
2026 State of AI Report: The Builder's Economy
How 300+ Executives Are Scaling AI Products

A year ago, boards wanted to hear the AI strategy. Now they want AI unit economics.
That shift, from whether AI works to whether it pays, is the through-line of this report. AI is no longer a differentiator on its own. It has become a core expectation. The challenge has moved from launching AI features to building businesses that can sustain and scale them.
Our findings draw on surveys of over 300 executives at software companies building AI products, including CEOs, heads of engineering, heads of AI, and heads of product. We also include perspectives from the ICONIQ community.
The data is clear to us: builders have converged on the application layer, agentic capabilities are now a top investment priority, and the economics are following. Margins are expanding, pricing models are being rebuilt to reflect actual usage and outcomes, and the gap between high-growth companies and everyone else appears to be widening.
Welcome to the Builder’s Economy.
Where are AI companies building in 2026?
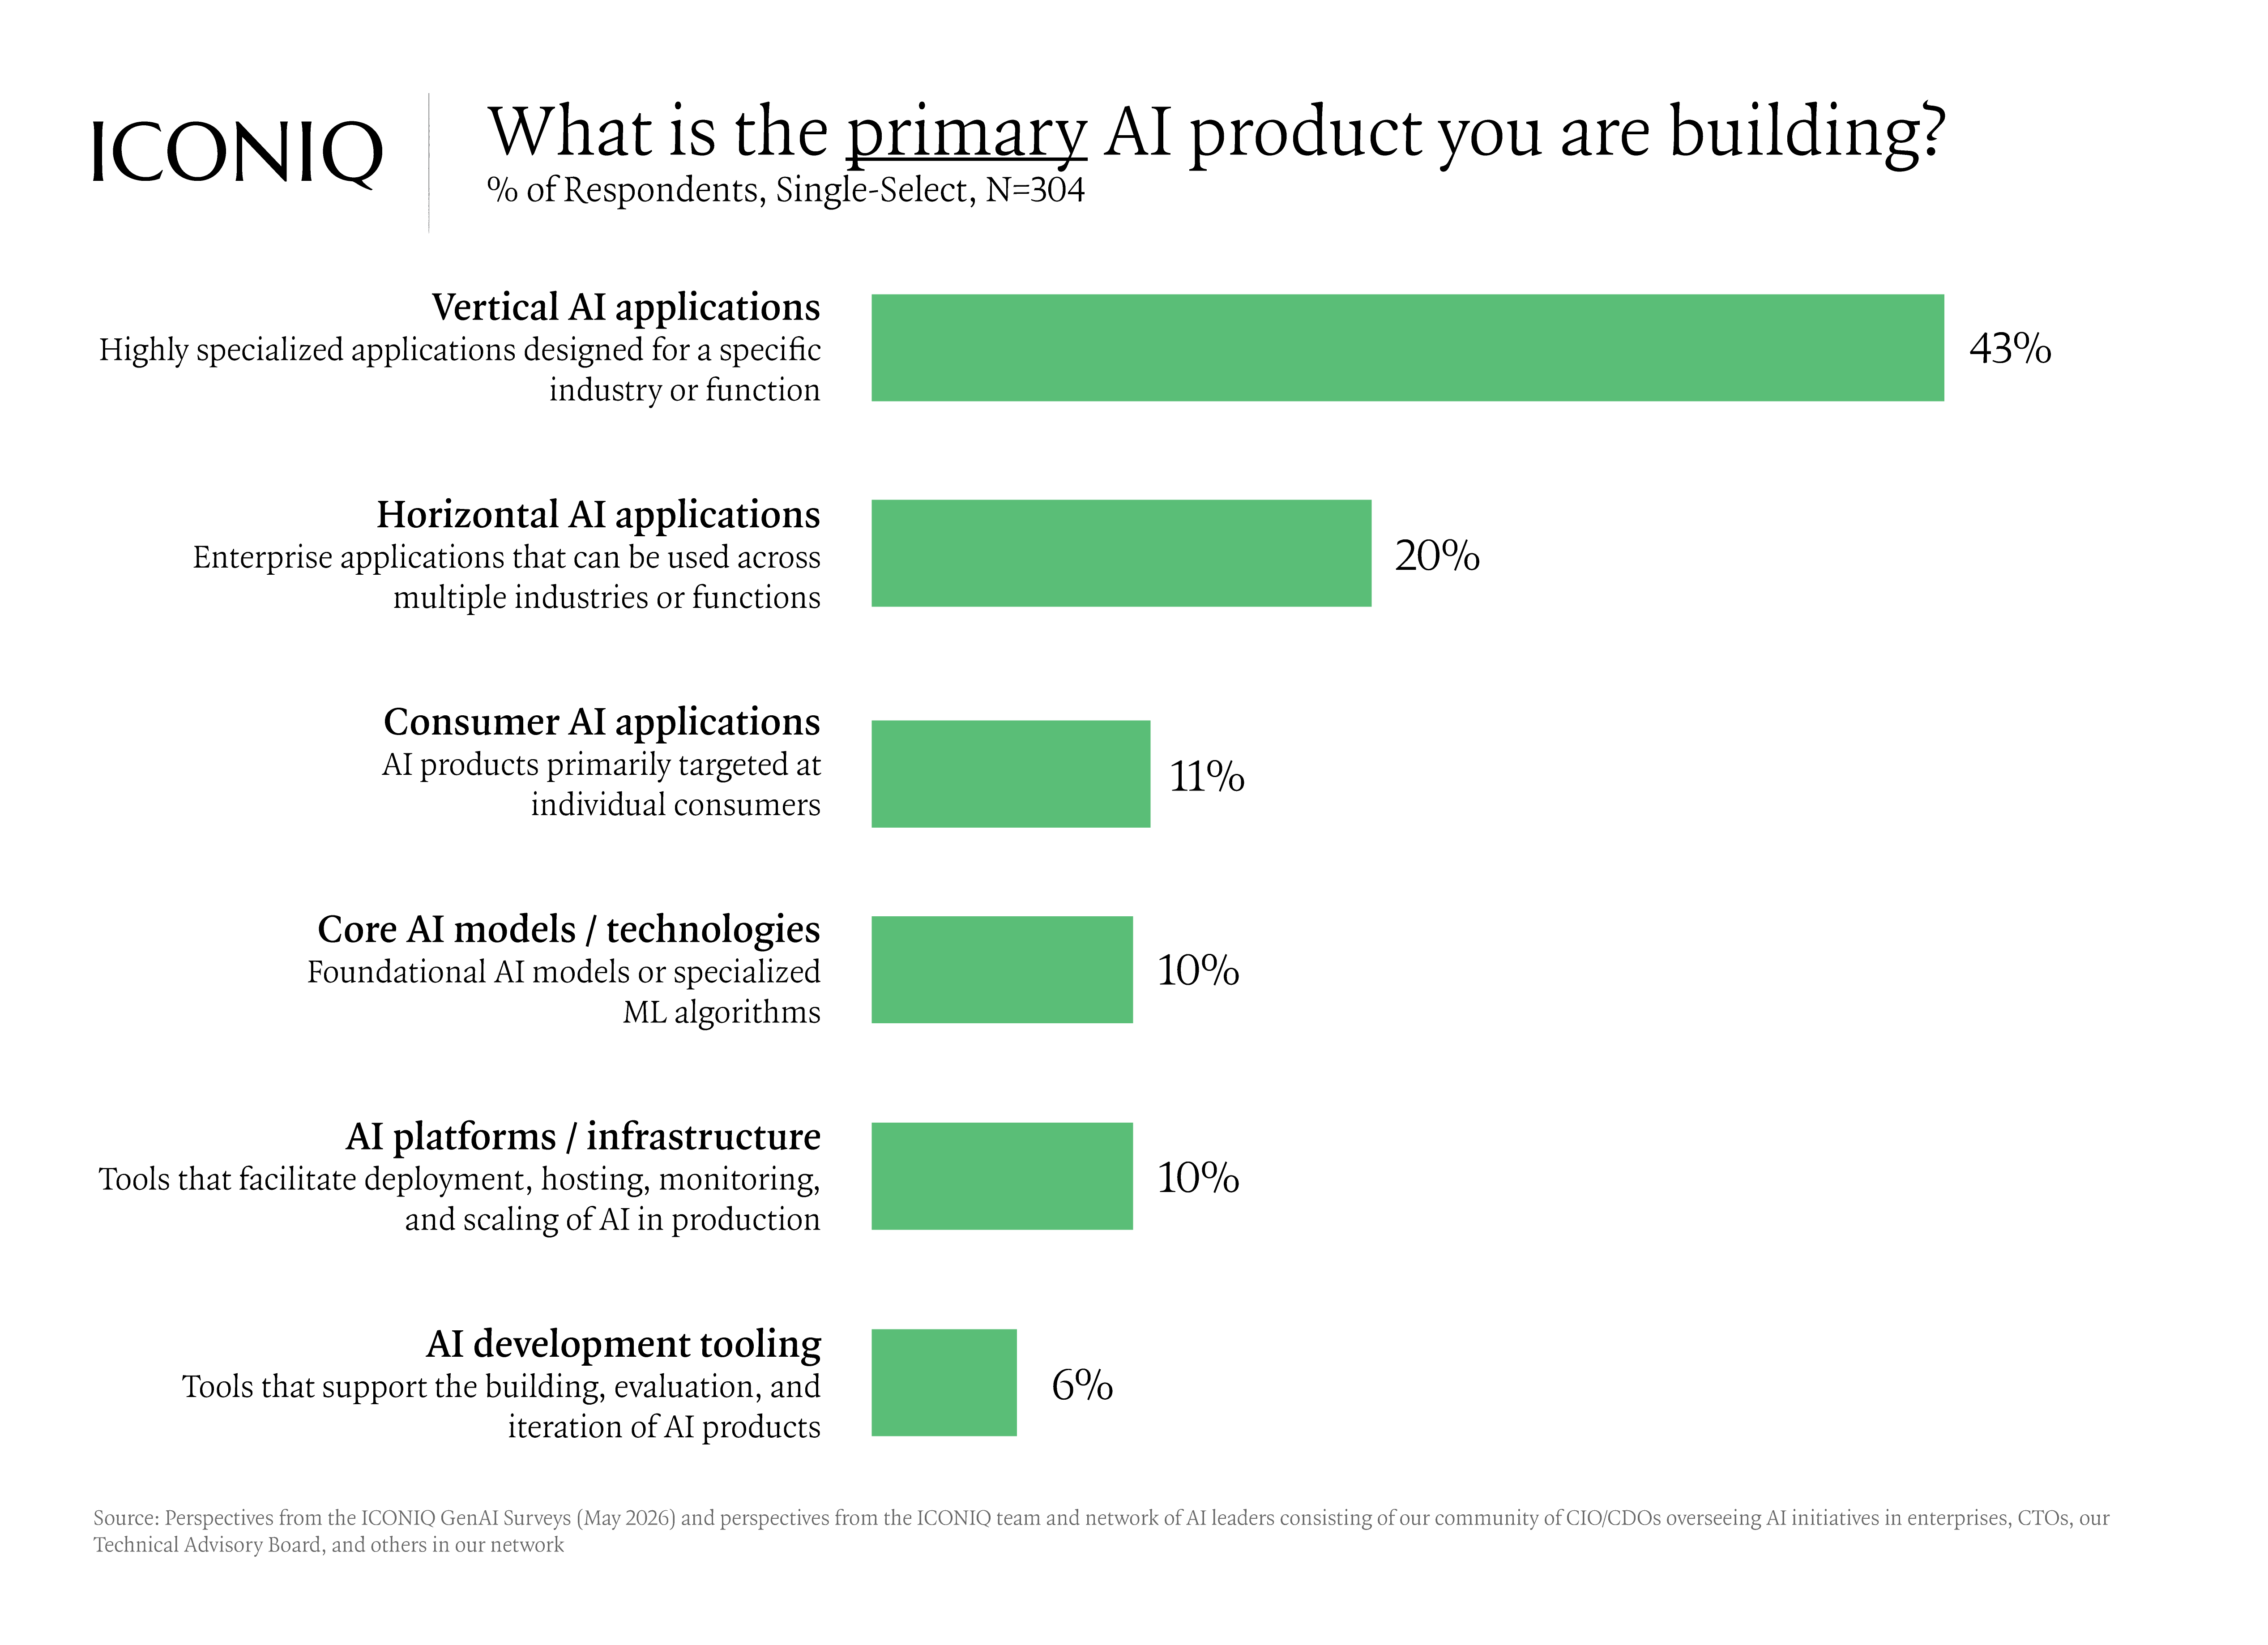
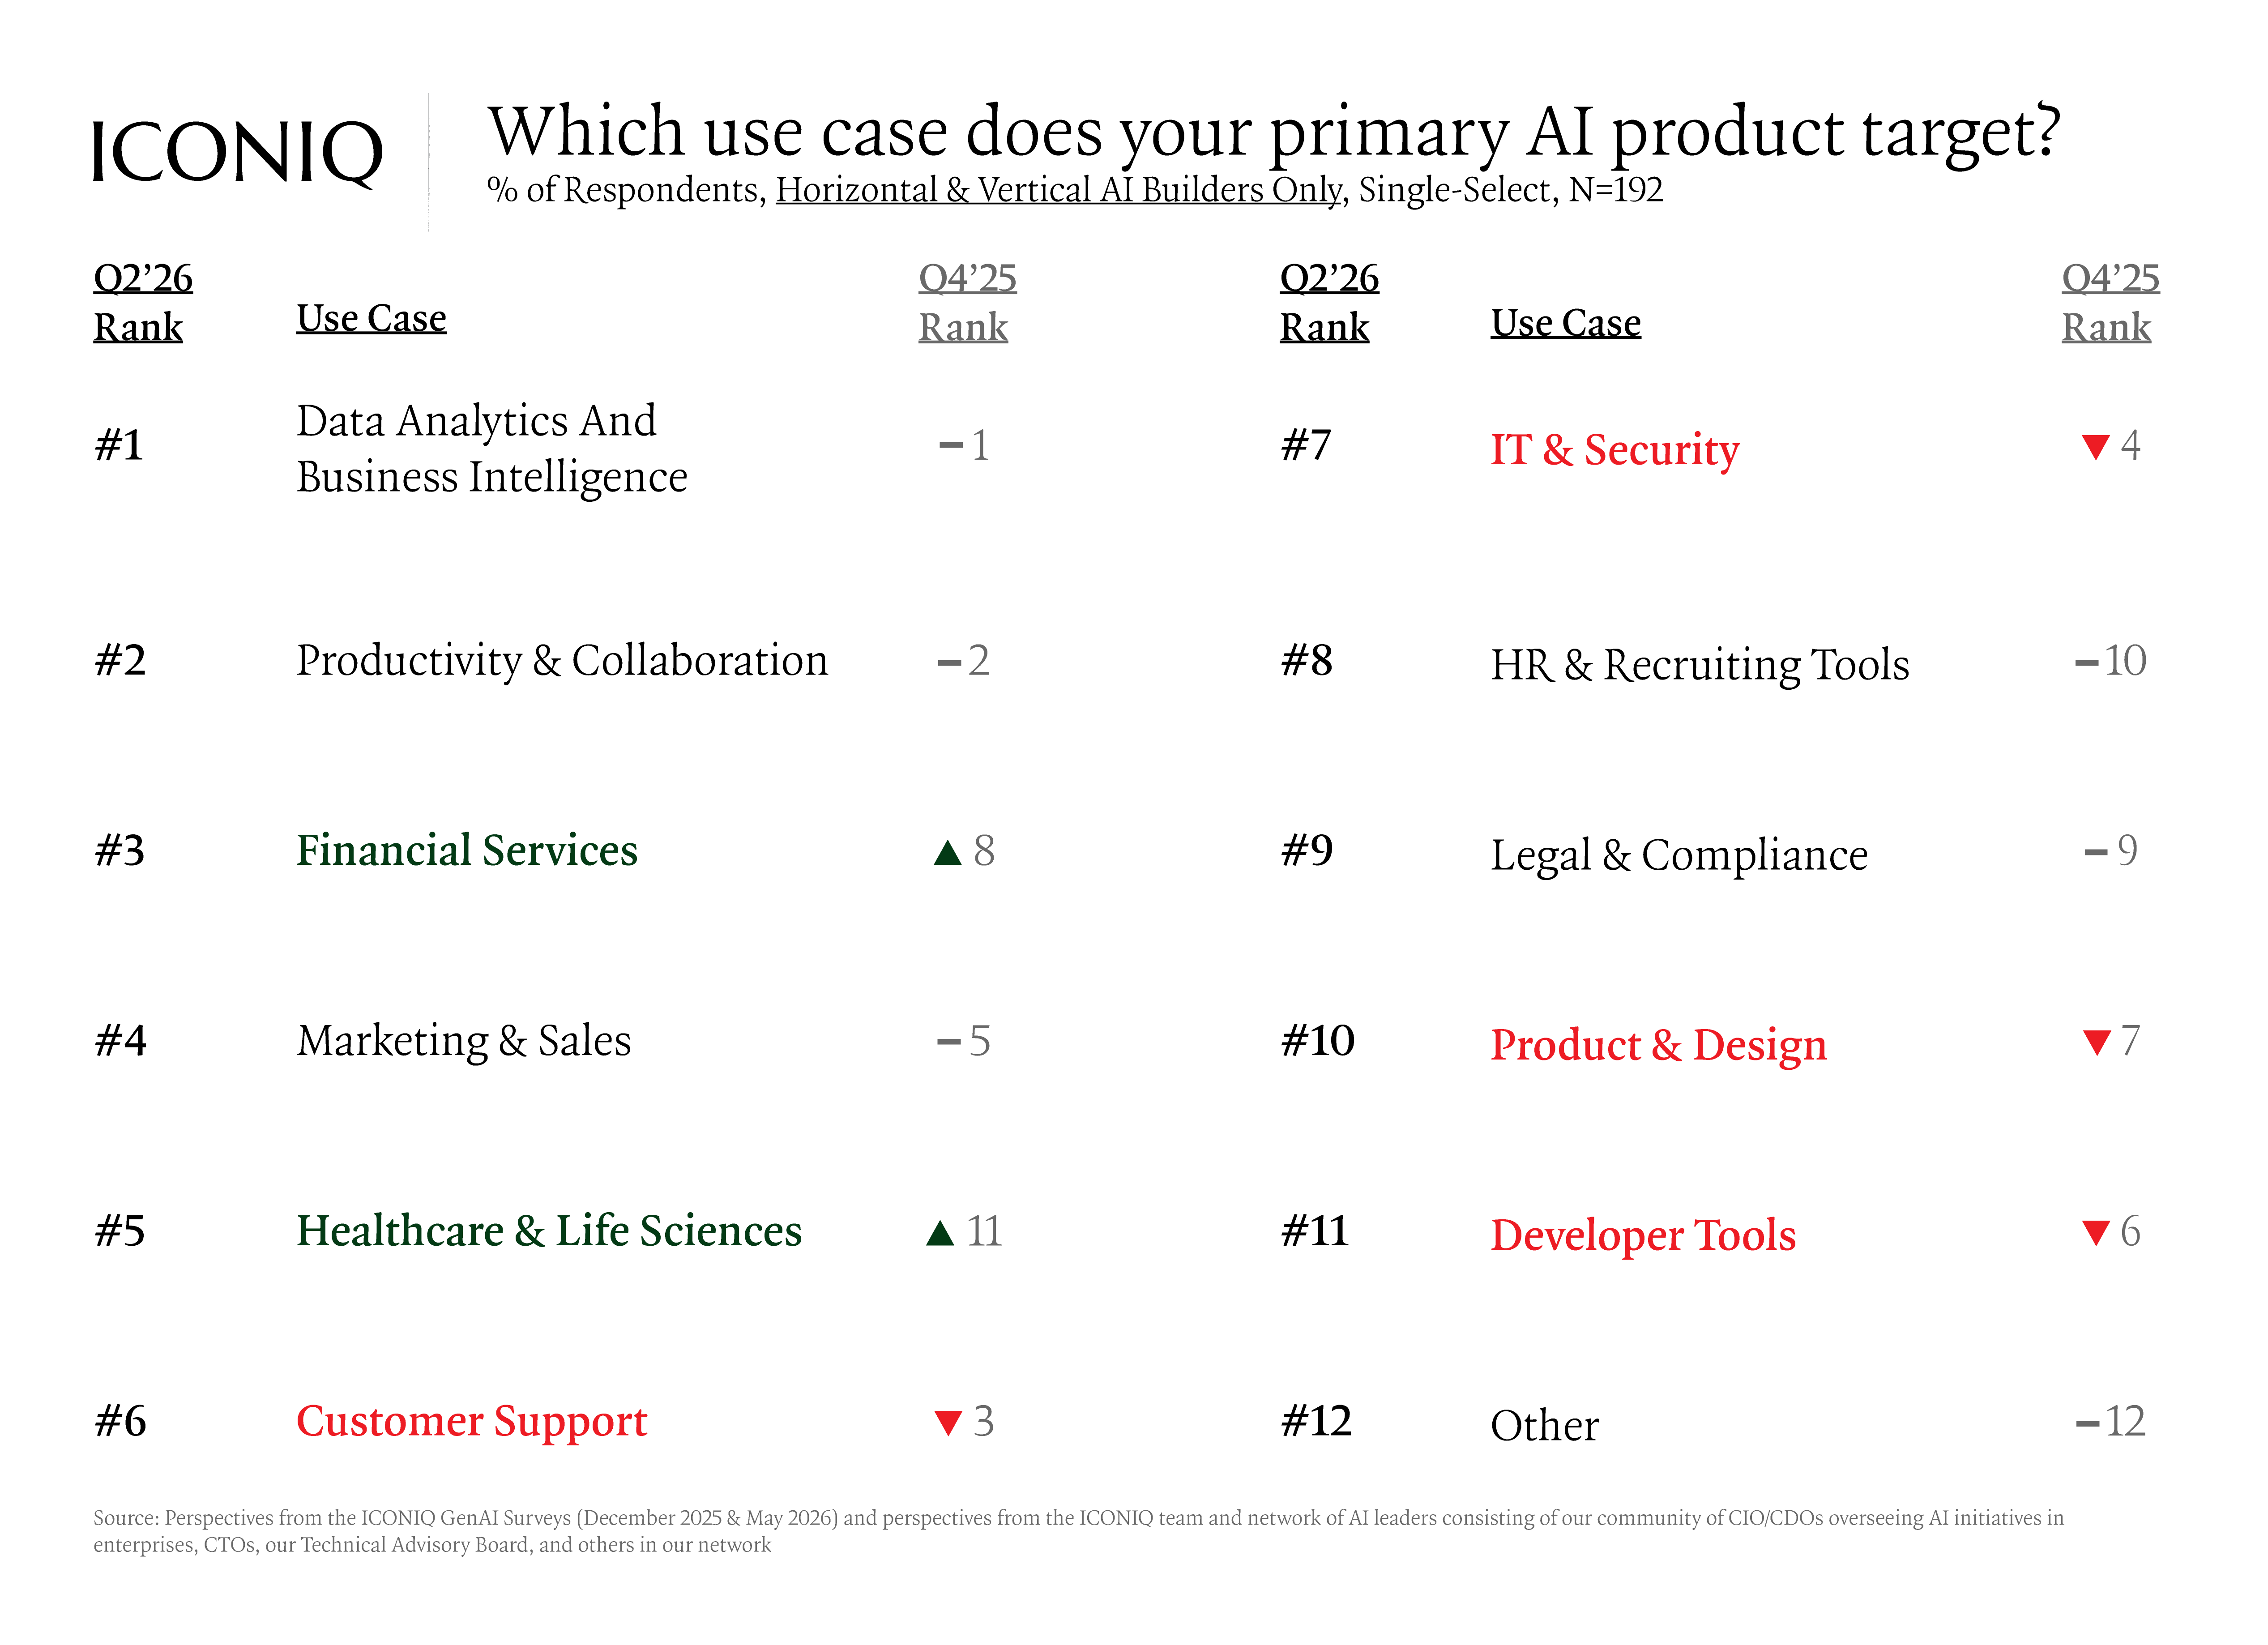
The center of gravity has moved towards to the application layer. Close to two-thirds of the builders we surveyed are working on horizontal or vertical AI applications, with vertical alone at 43%, and momentum moving toward complex, regulated domains. Products targeting financial services and healthcare use cases rose the fastest, because a product embedded in a real workflow appears to be harder to dislodge than a general-purpose model sitting one layer up.
Underneath those products, multi-model is now generally the default. Companies are running an average of about 3.3 models, with licensed 3rd-party APIs as the most used model type.
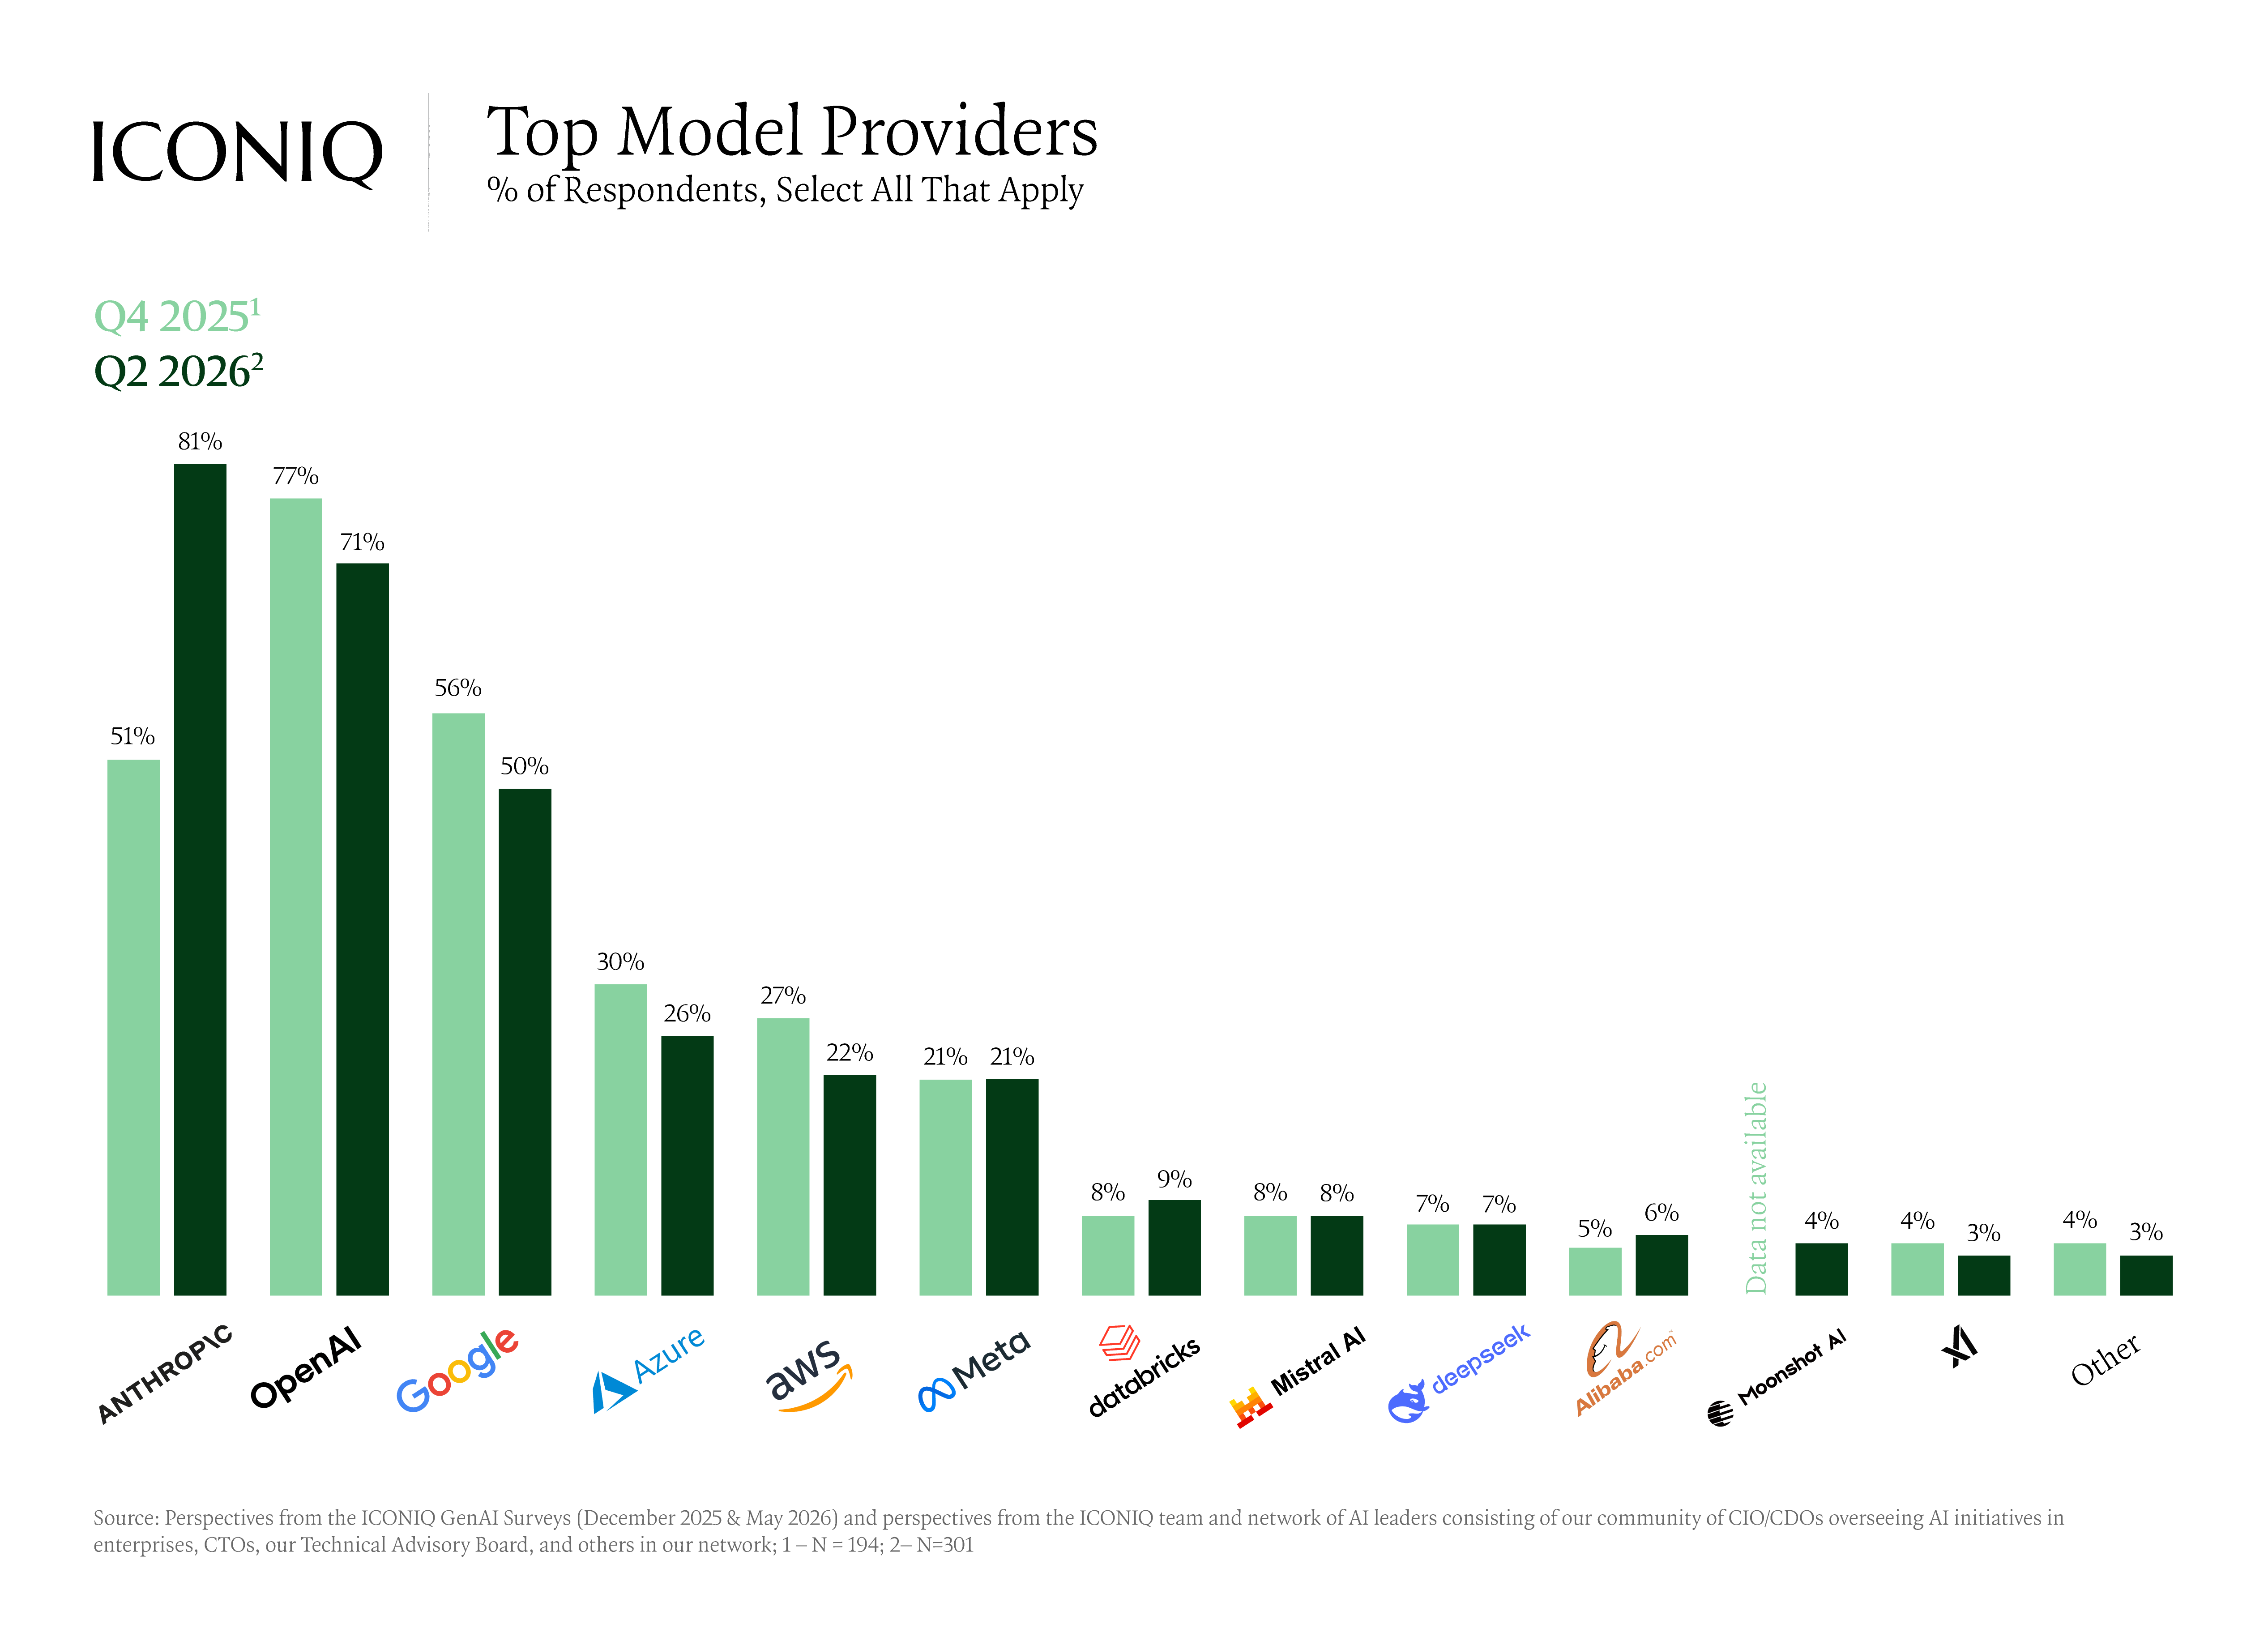
Nearly half choose to use 2+ model types, suggesting multi-model strategies are becoming the default. Anthropic became the most-cited provider, climbing from 51% to 81% adoption in six months.
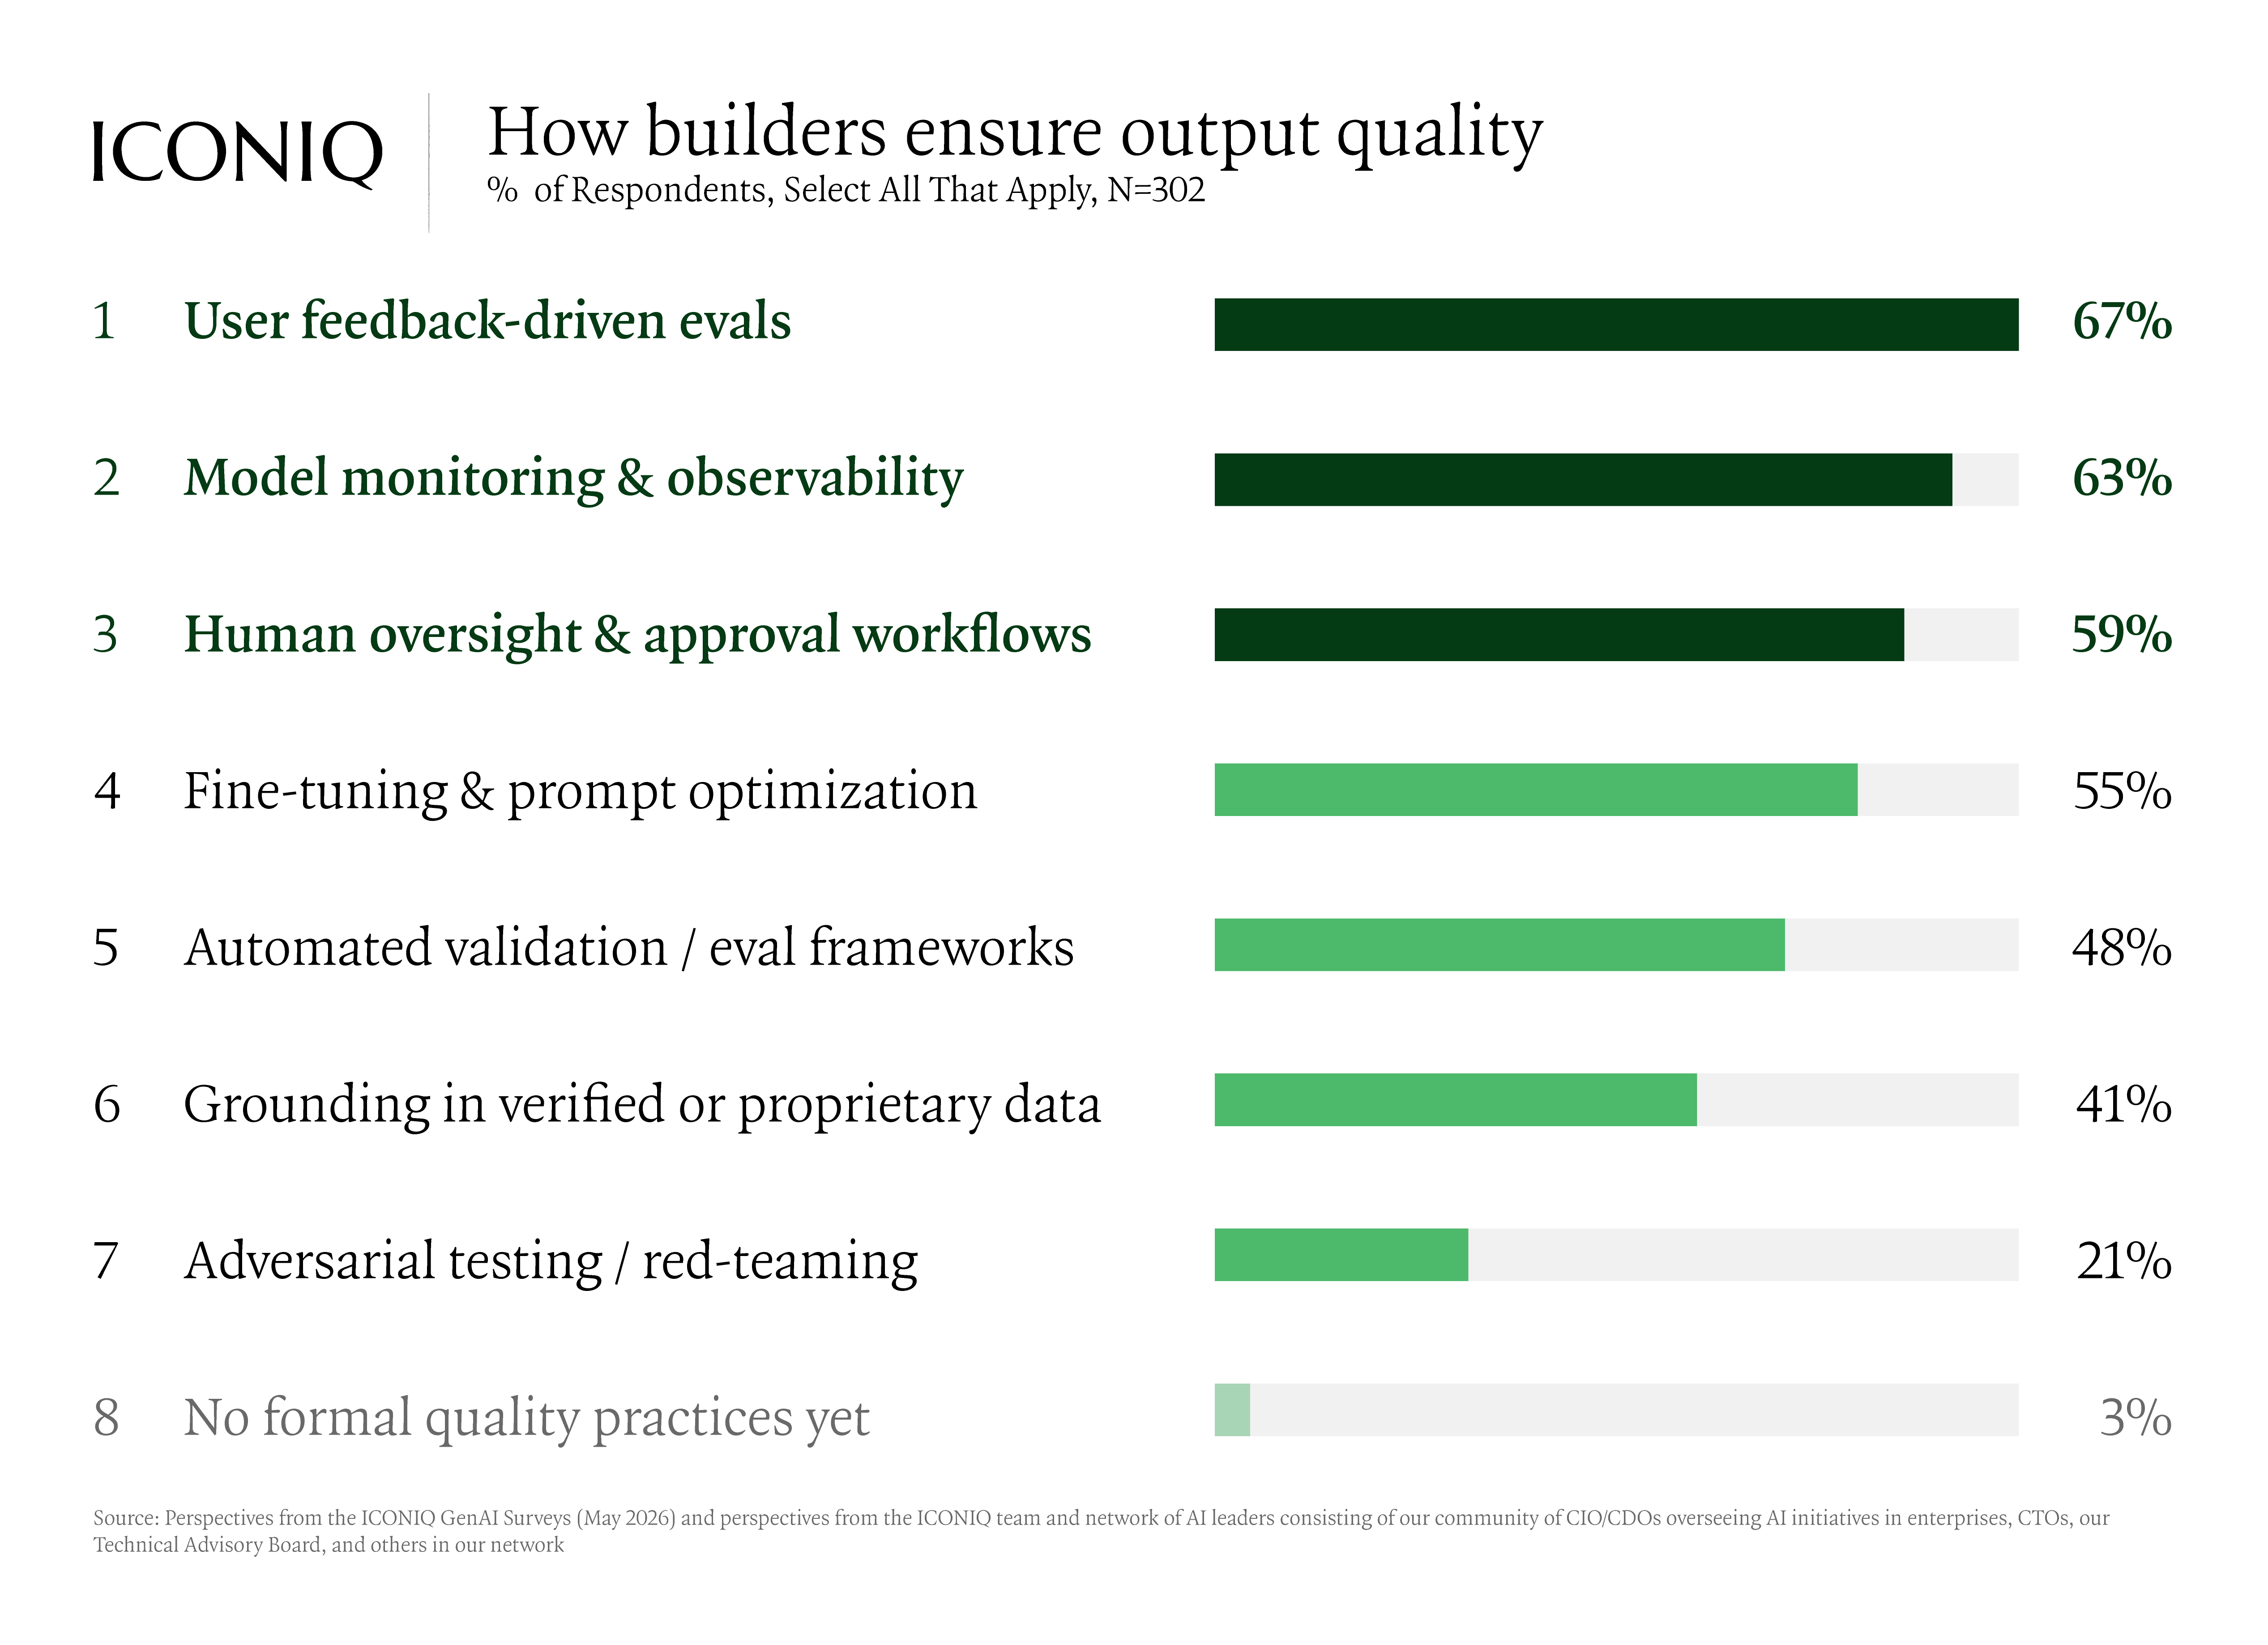
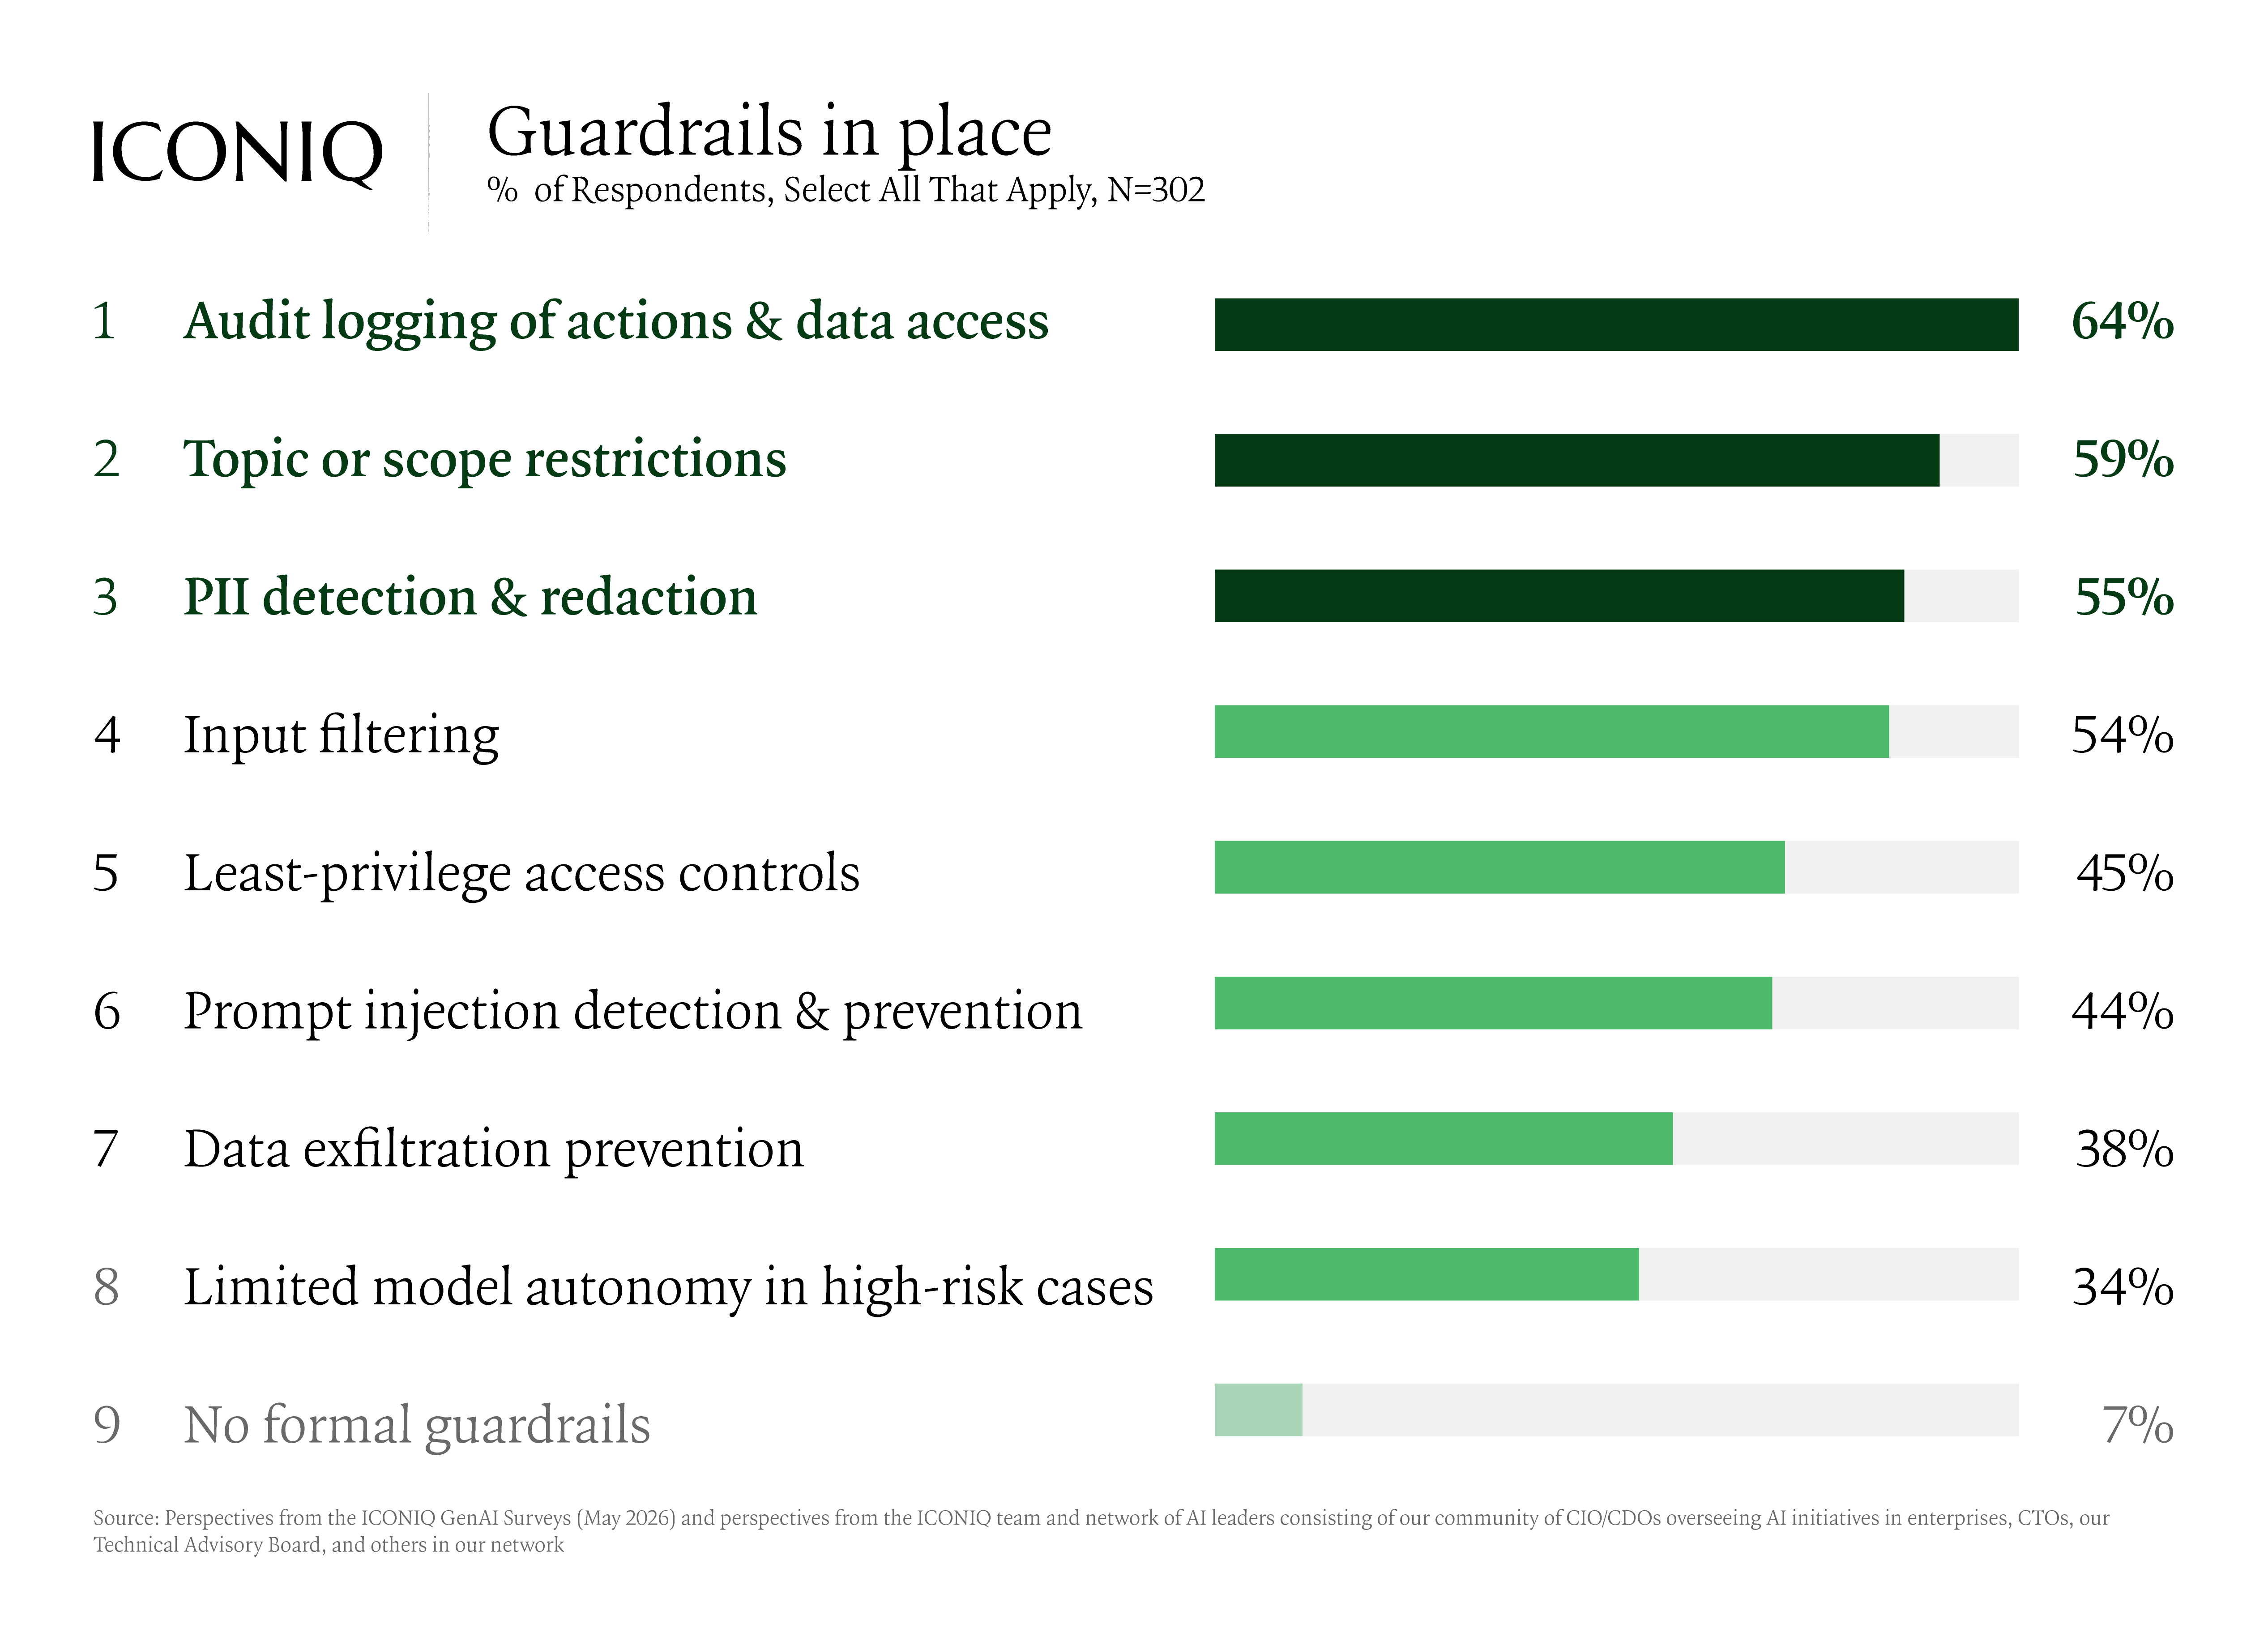
That enterprise pressure is exposing a gap in trust infrastructure. Quality assurance is still mostly reactive, caught through user feedback at 67% and model monitoring at 63%, rather than with testing that proactively identifies problems—proactive adversarial testing remains a minority practice at 21%. Data-protection guardrails are nearly universal, but defenses against AI-specific risks lag, with prompt injection detection at 44% and data exfiltration prevention at 38%.

.png)
Are AI products paying off?
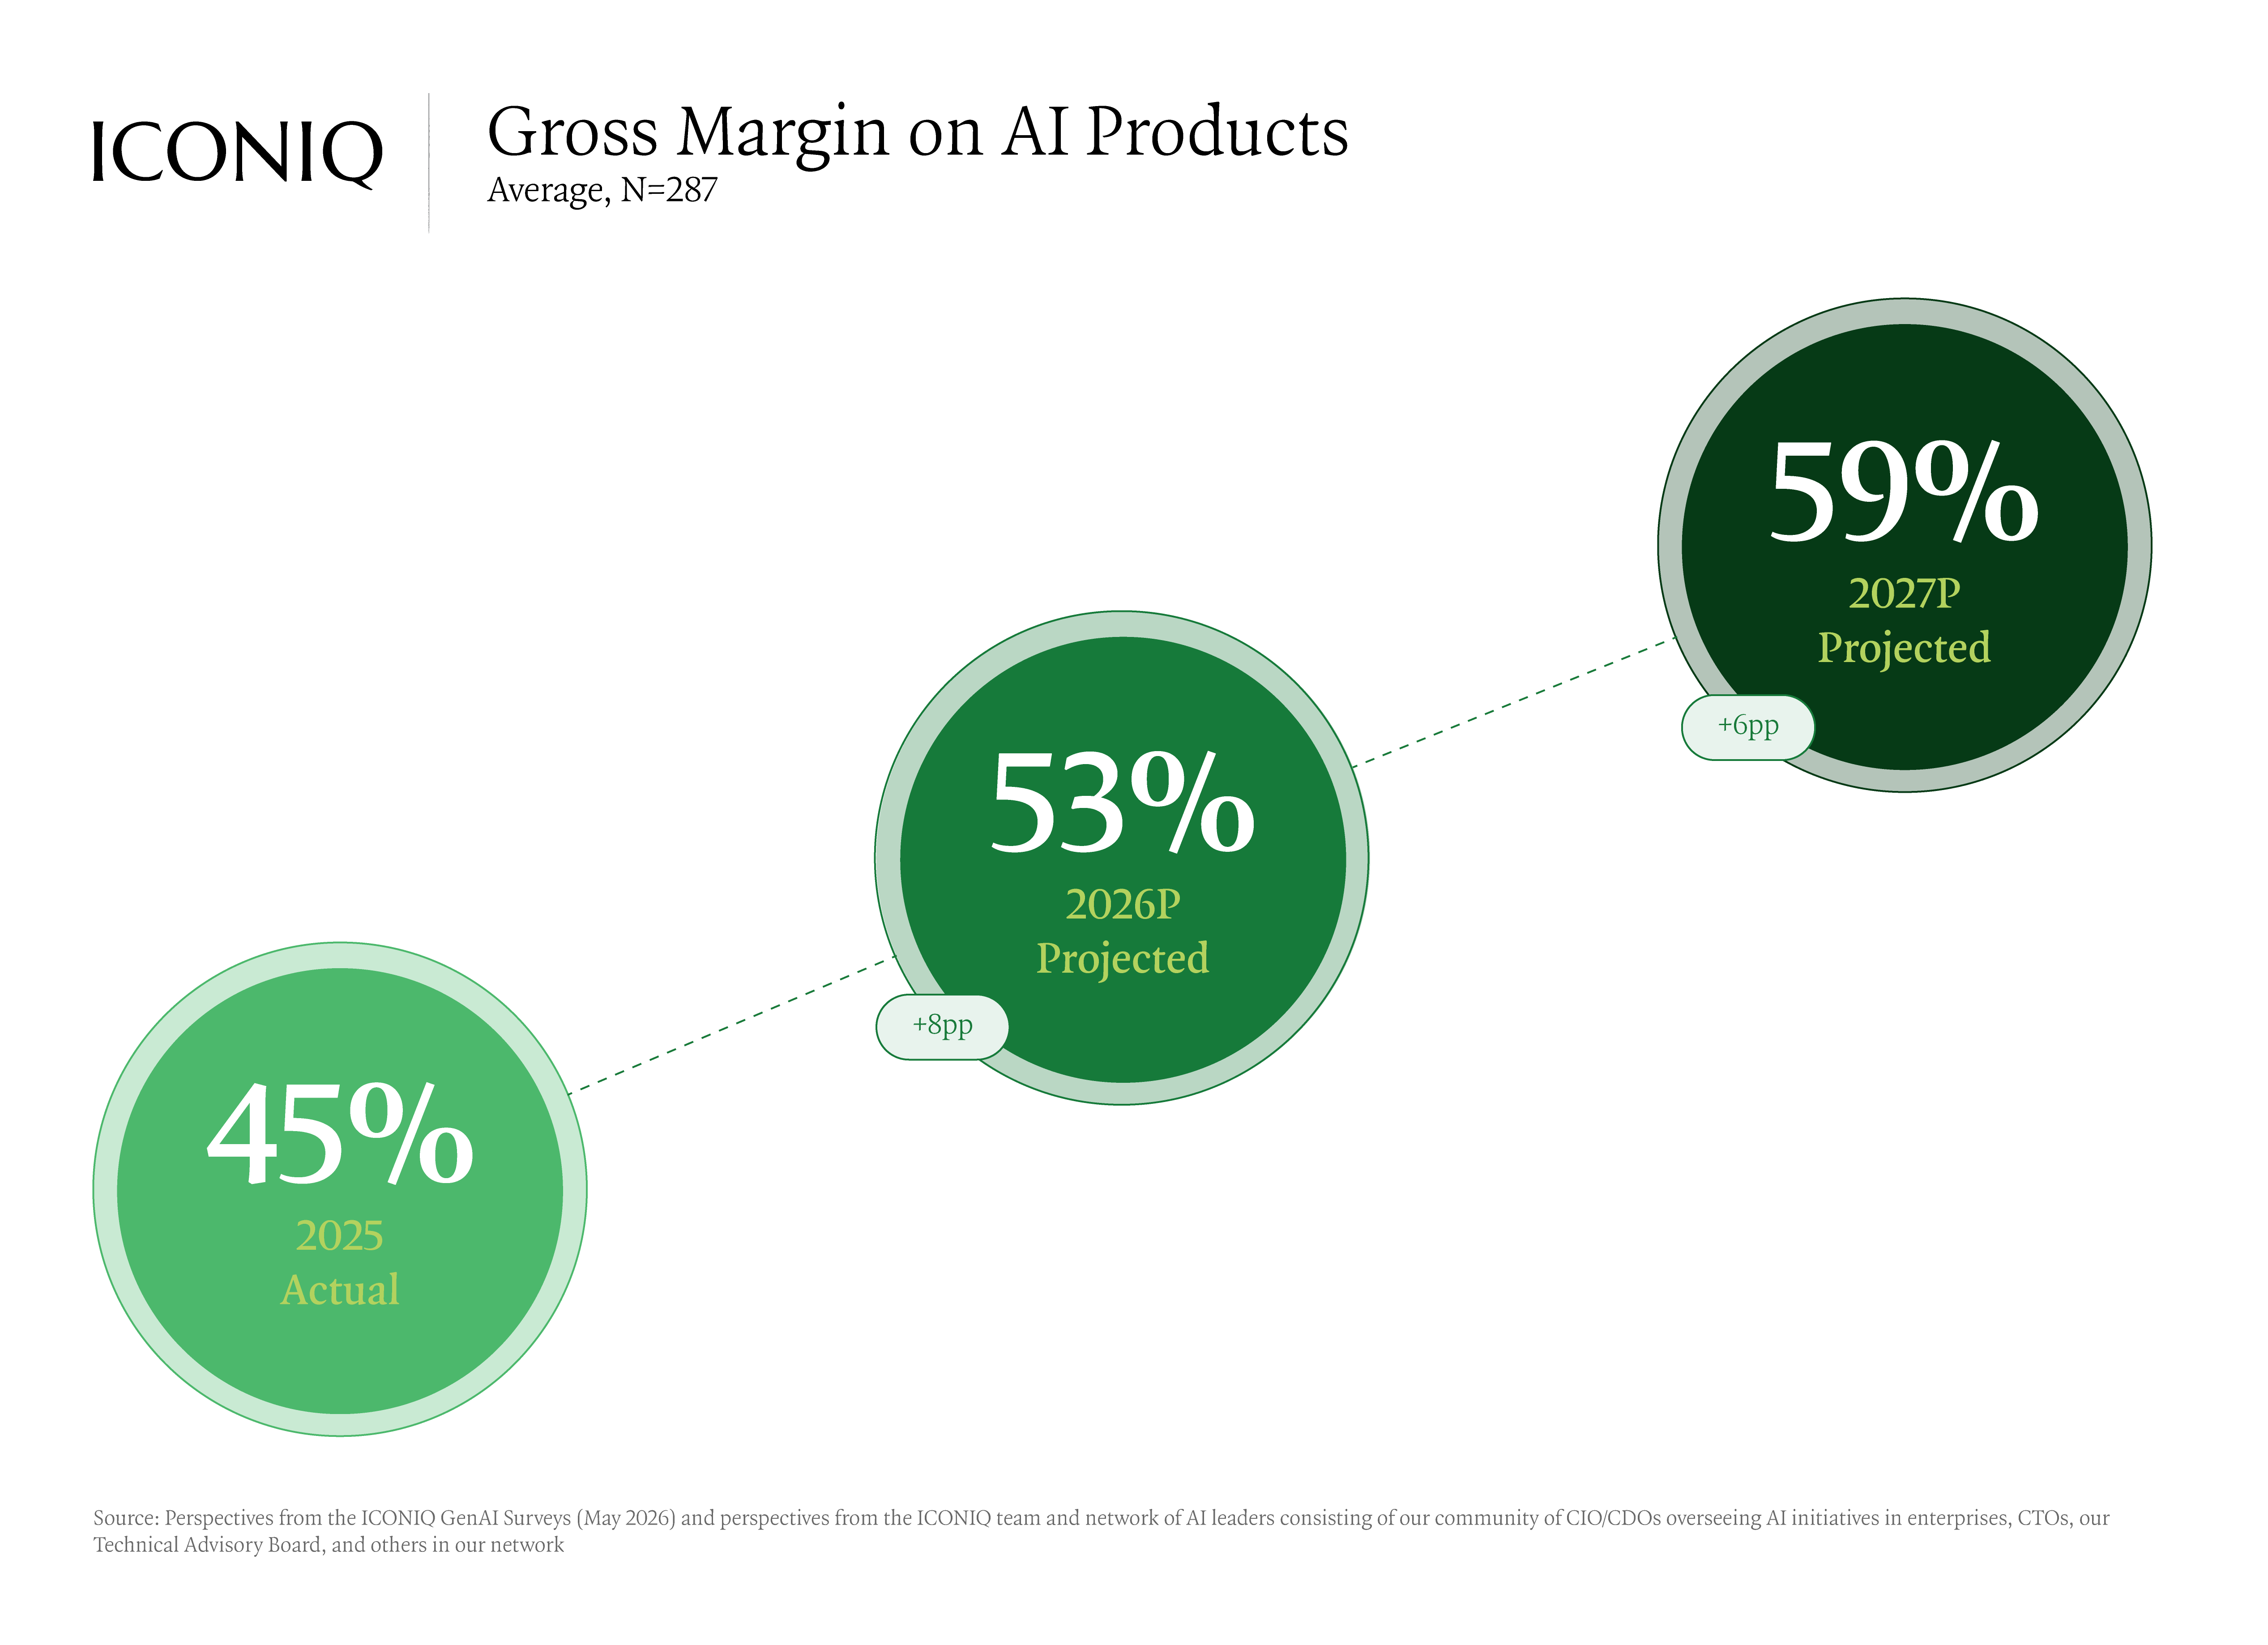
The clearest evidence that AI is creating value is that it shows up in the financials. AI products grew from 32% of revenue in 2025 to a projected 42% this year, and are on track for roughly 53% by 2027. Gross margins are improving, jumping from 45% in 2025 to a projected 53% in 2026, and 59% in 2027.
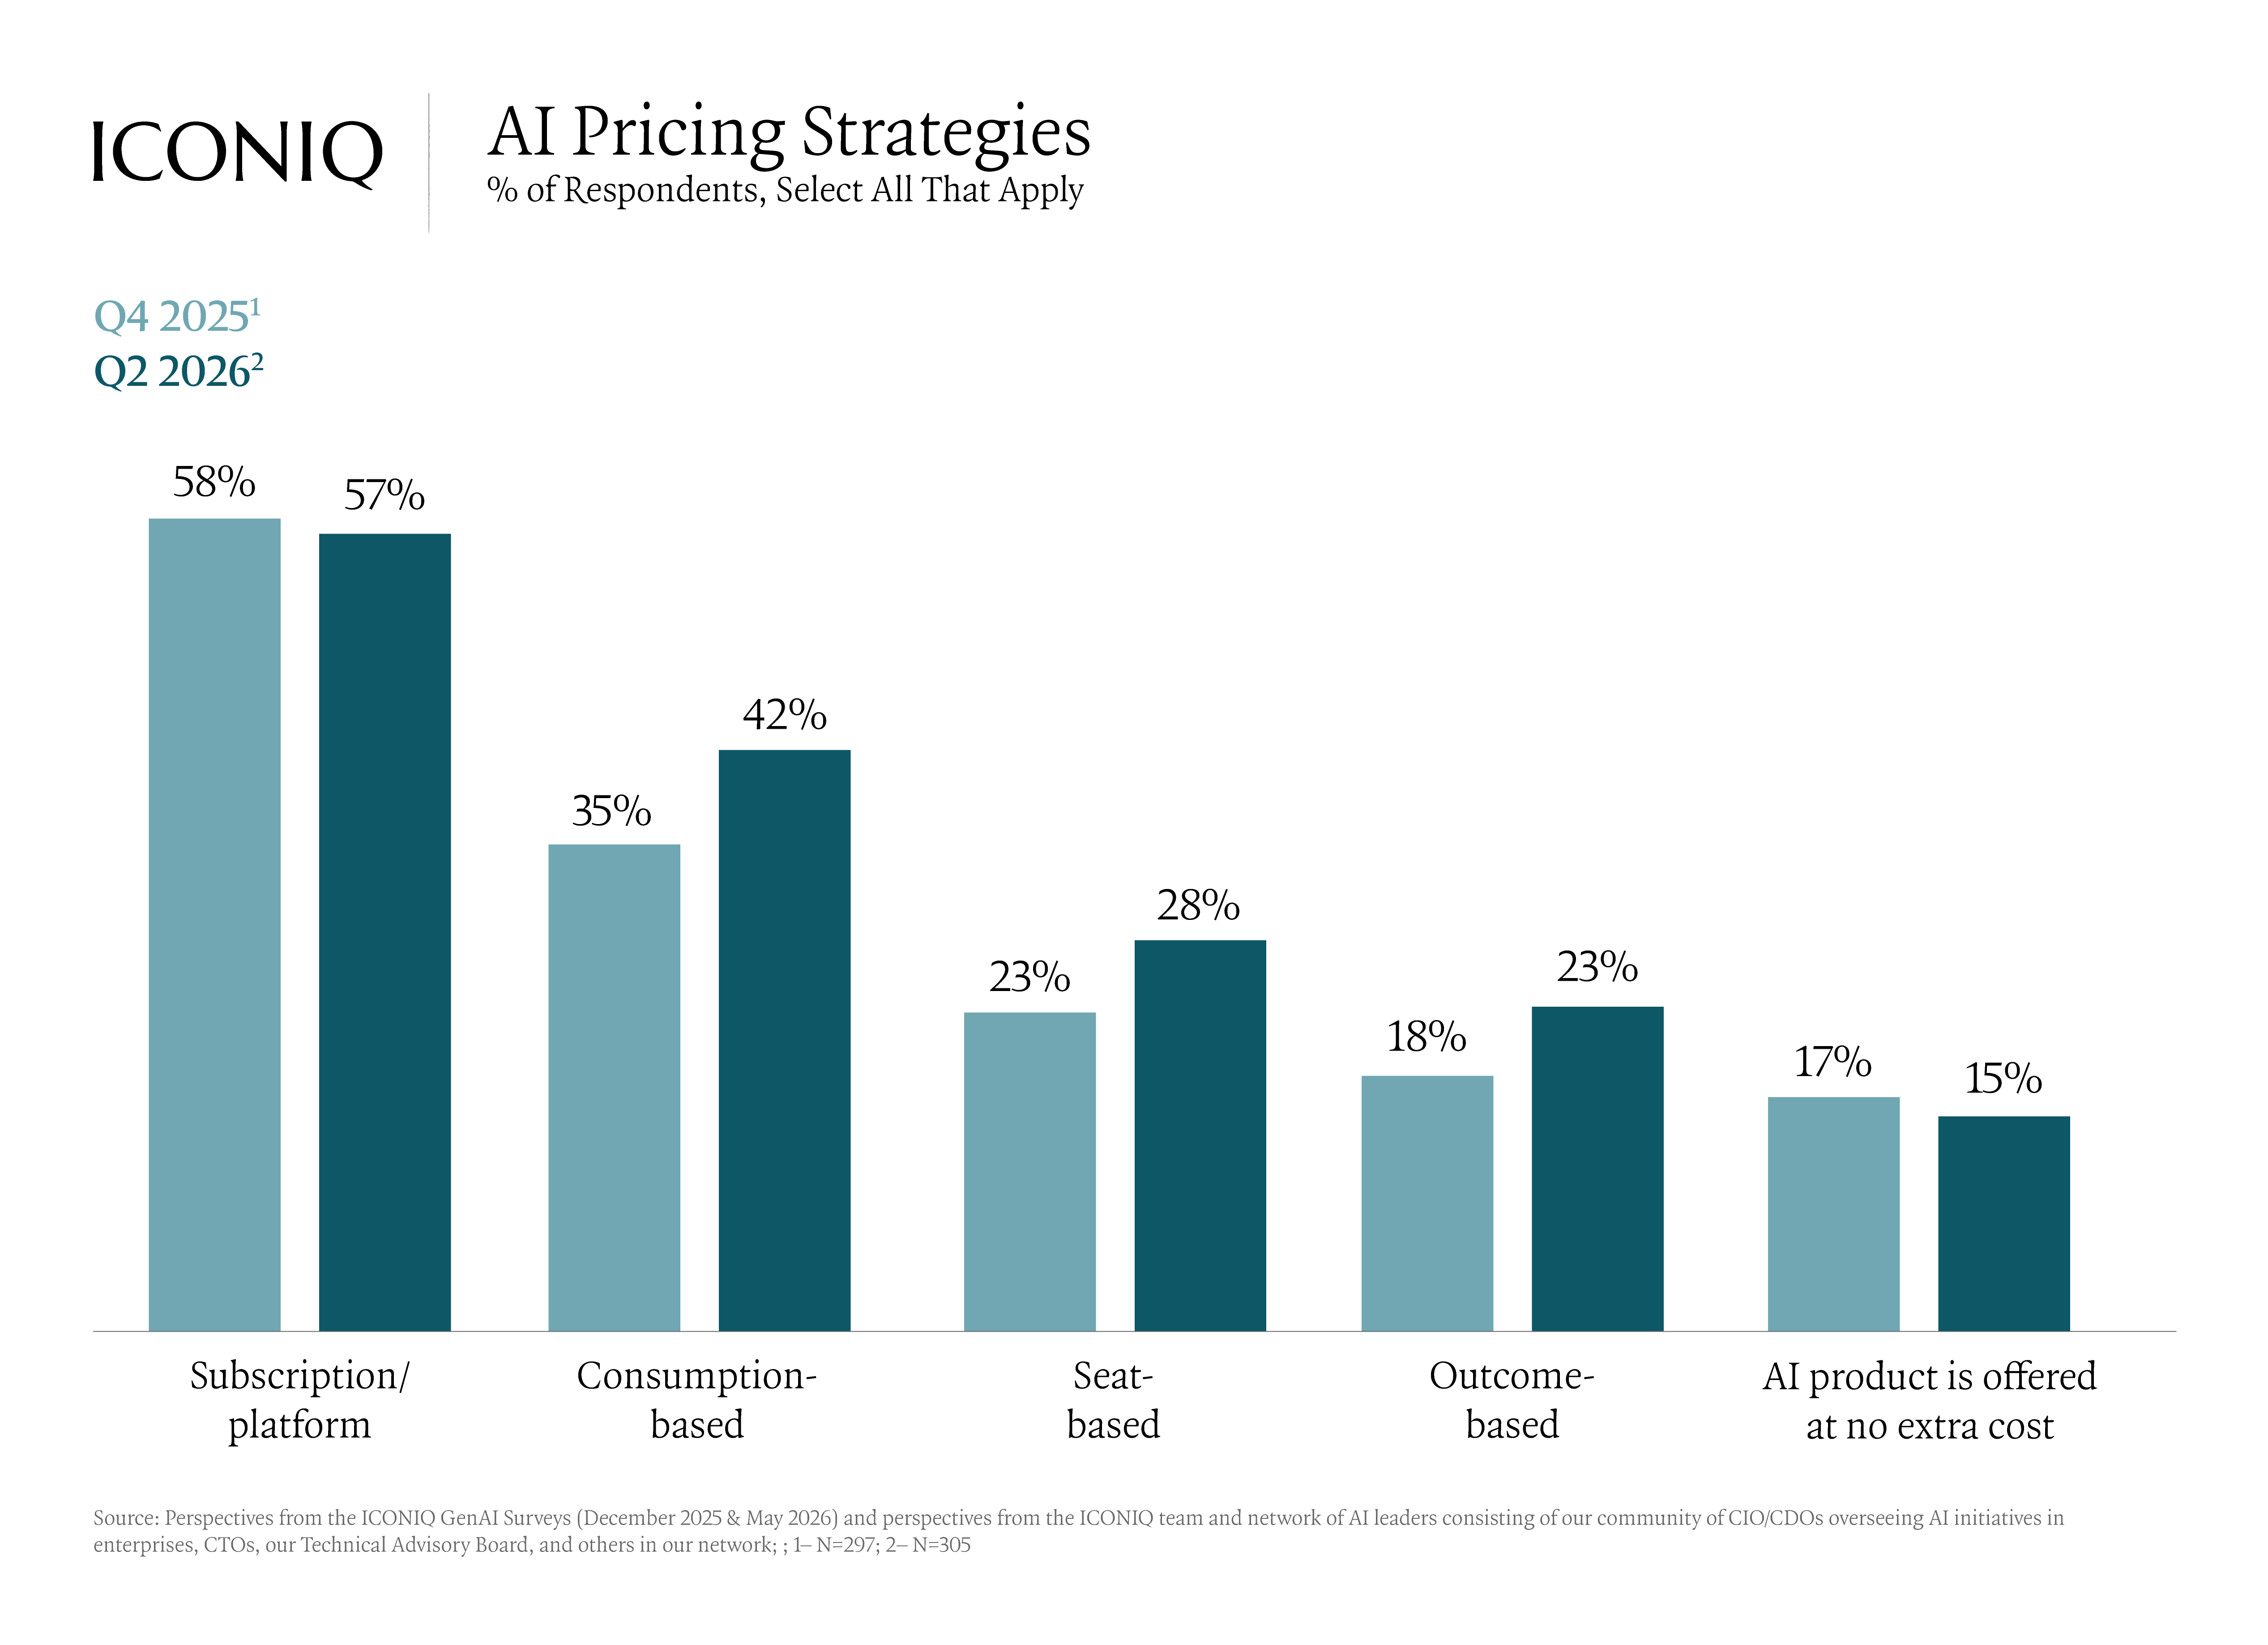
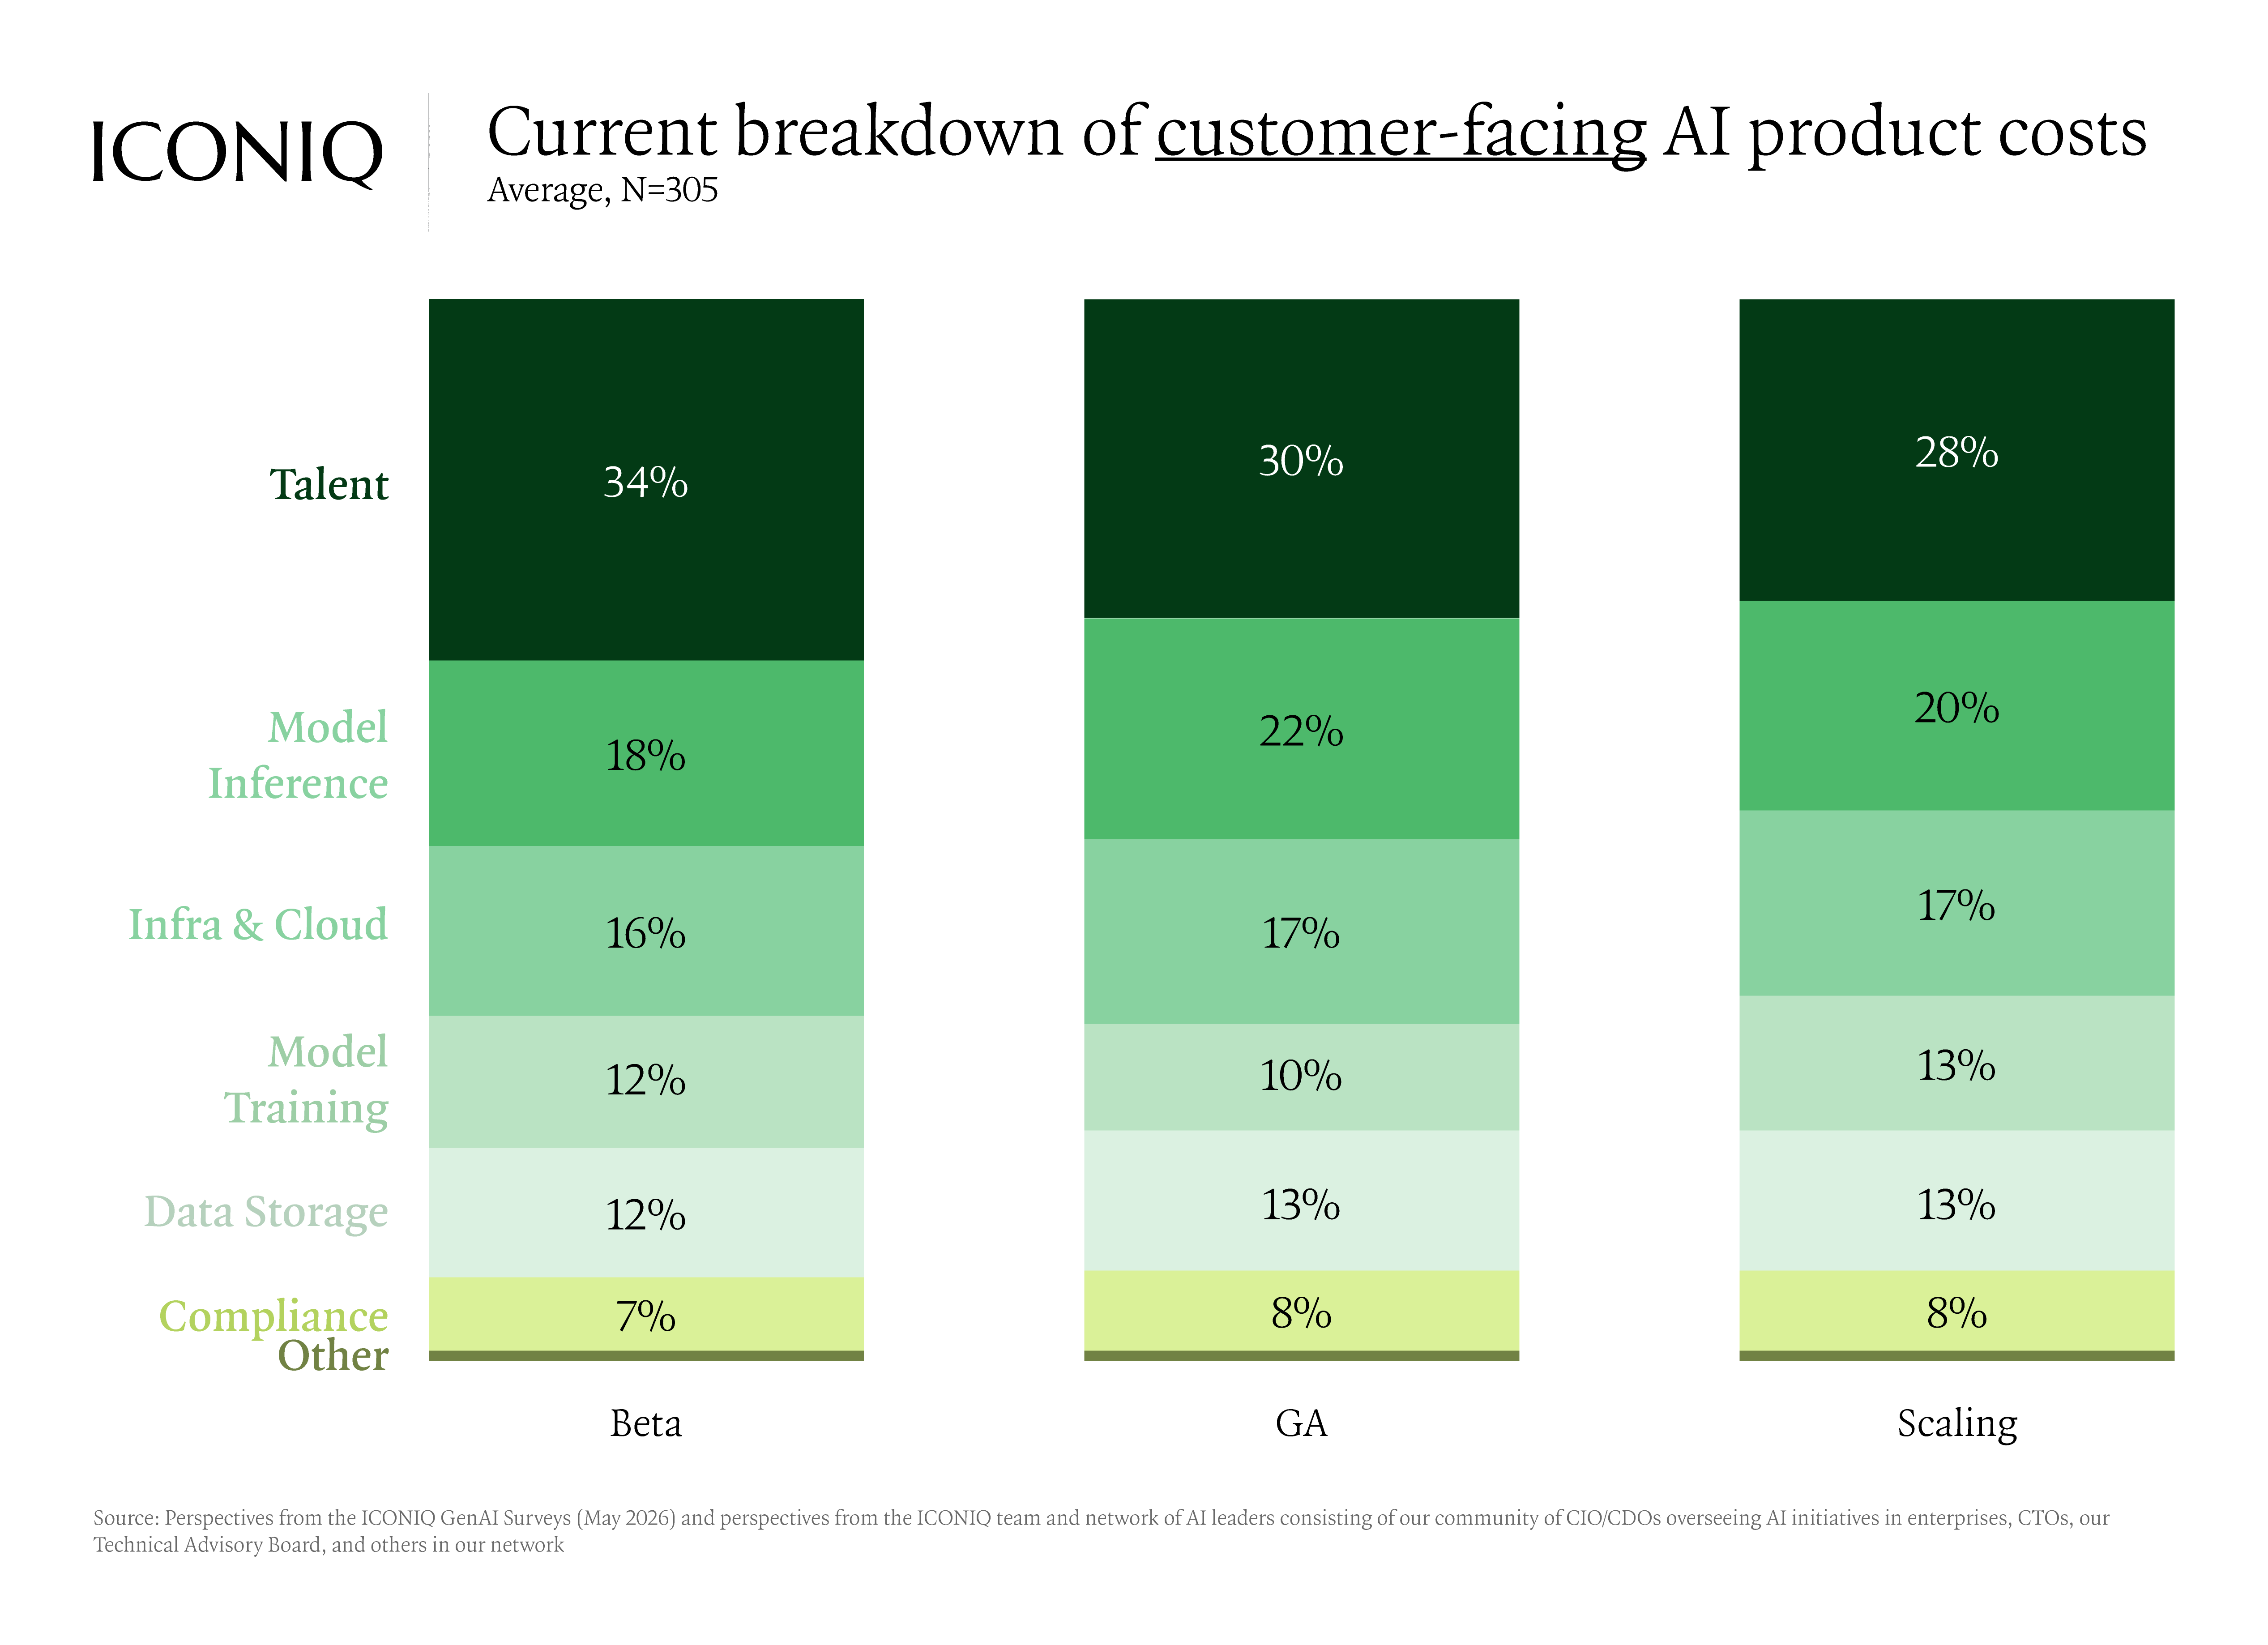
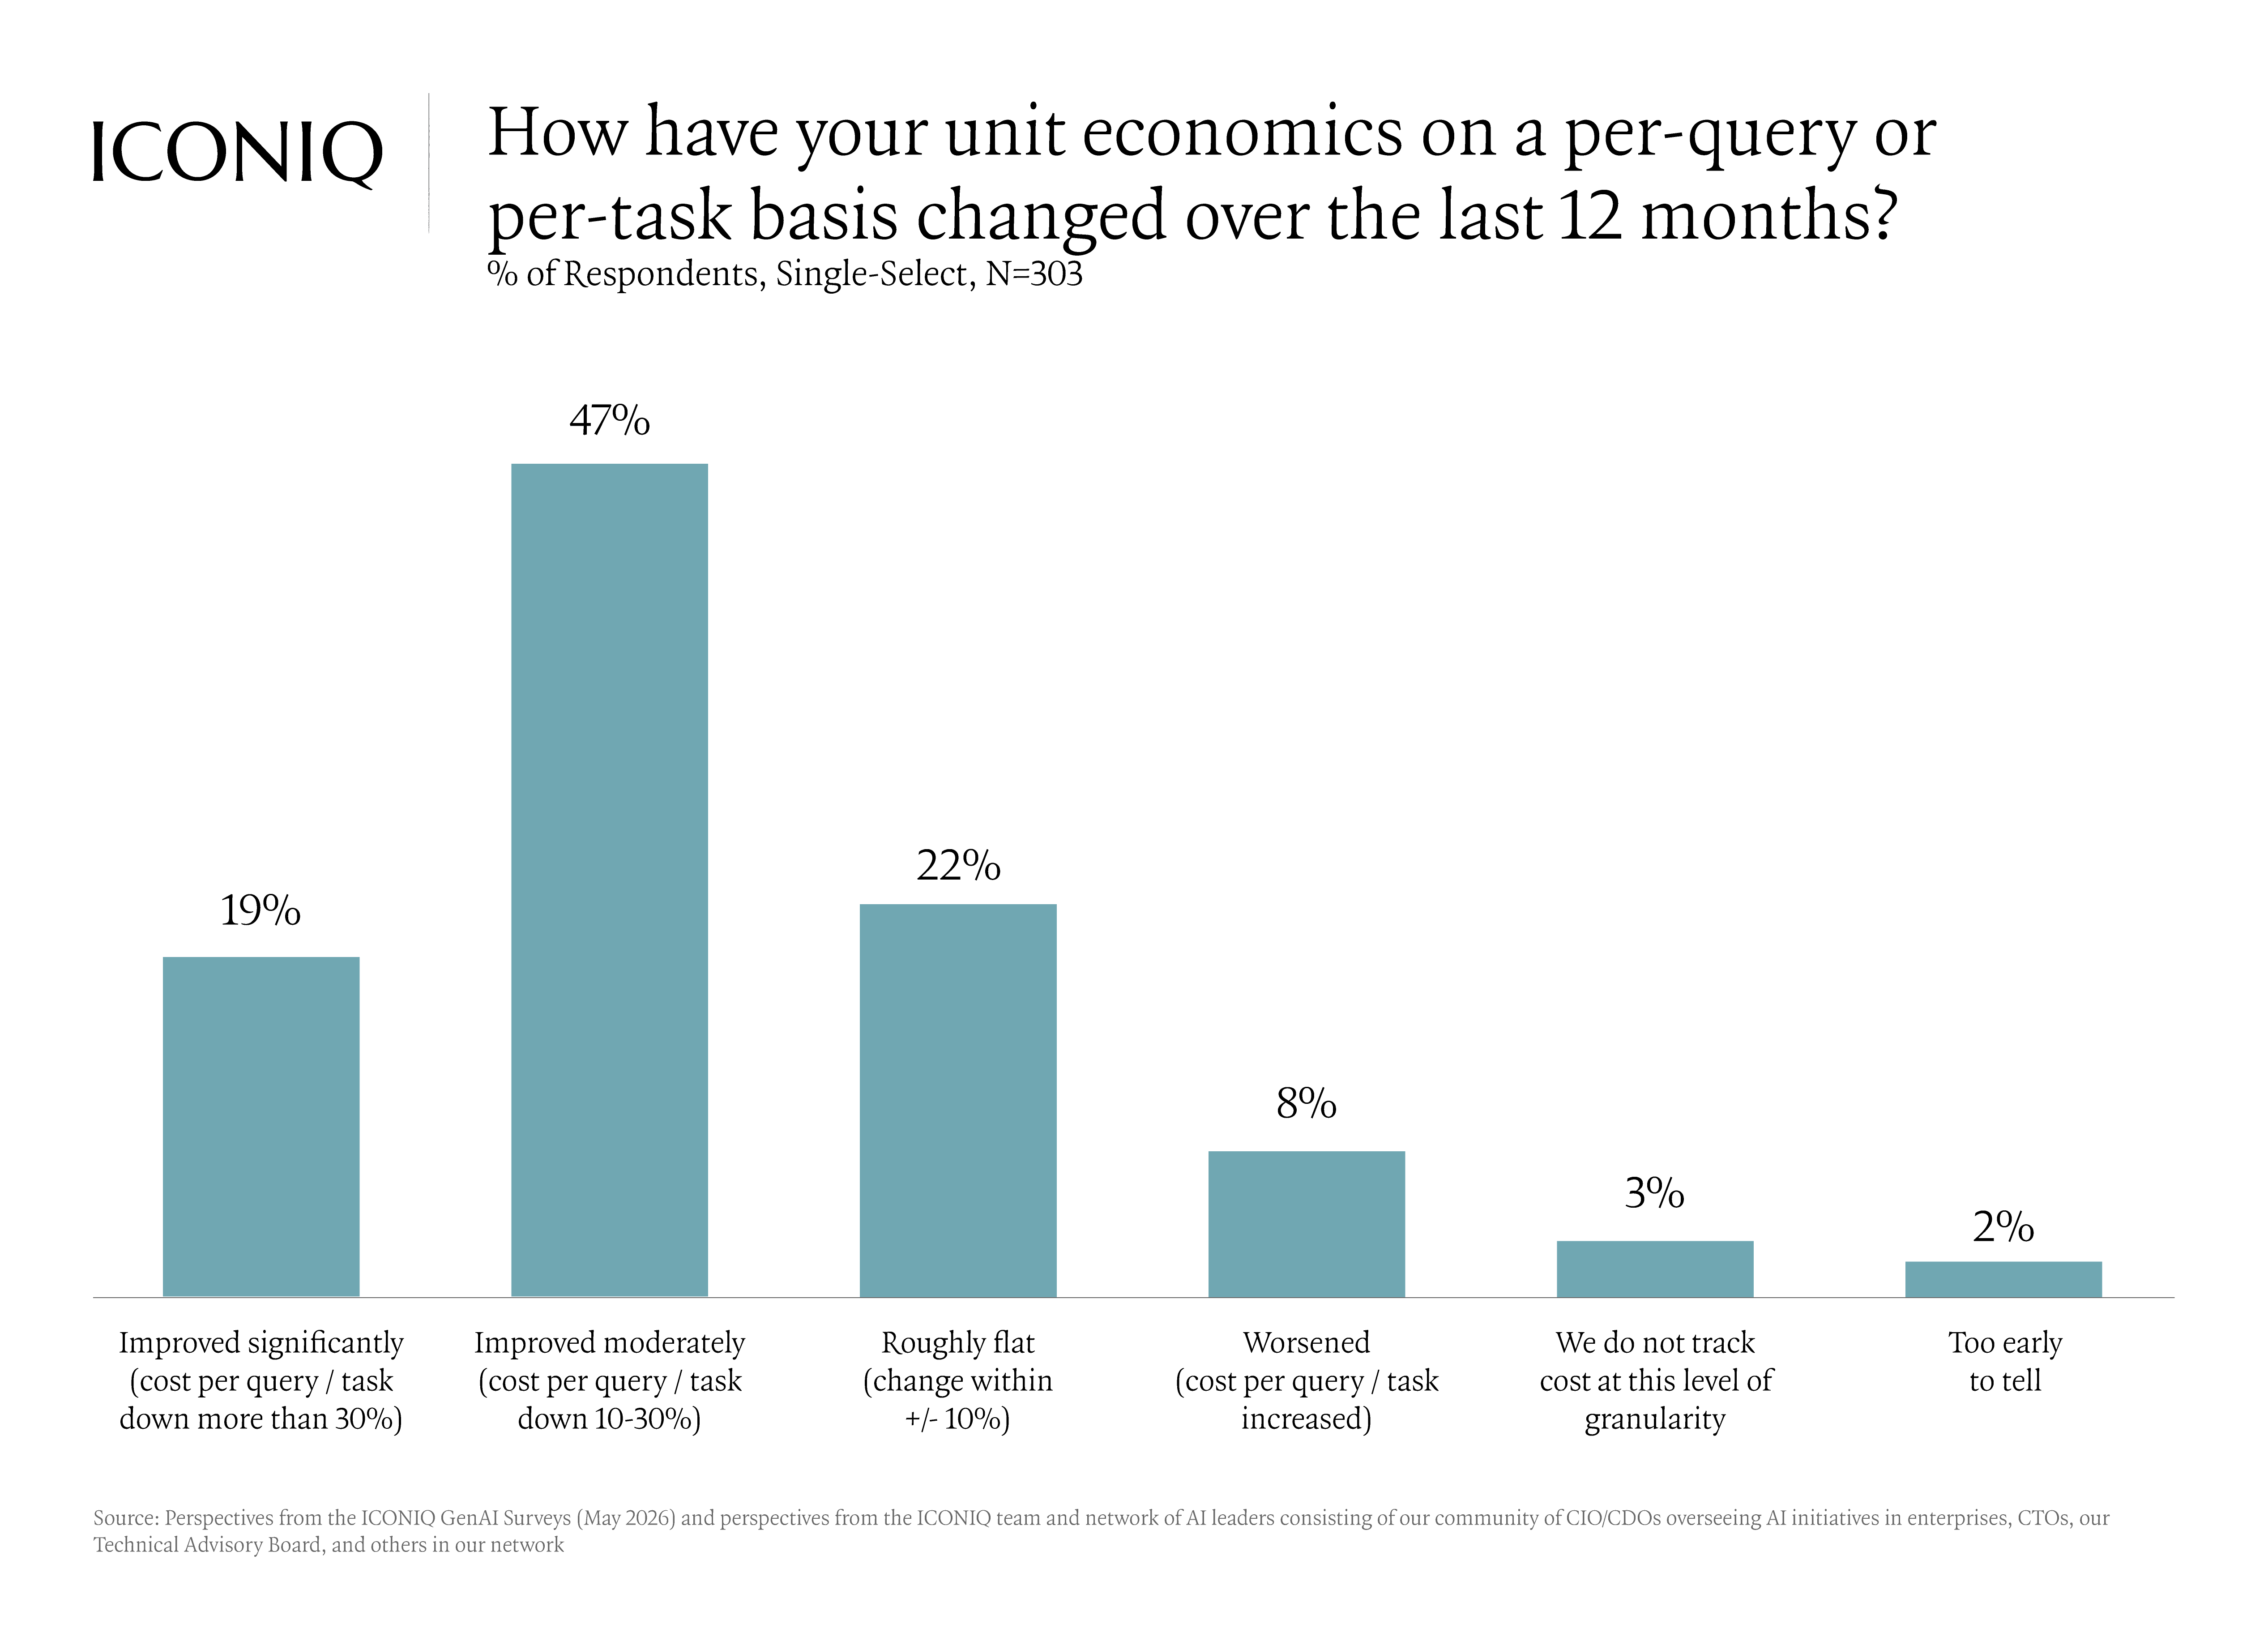
Pricing is being rebuilt to match. Subscriptions remain most common, but consumption-based pricing rose from 35% to 42% in six months, and outcome-based from 18% to 23%. On average, companies are blending 1.7 pricing models. On the cost side, two-thirds report improved per-query unit economics, helped by managing inference costs, improved model routing strategies, and revenue growth that creates cost leverage. As products scale, talent's share of cost falls while inference rises.
How is AI reshaping the org chart in 2026?
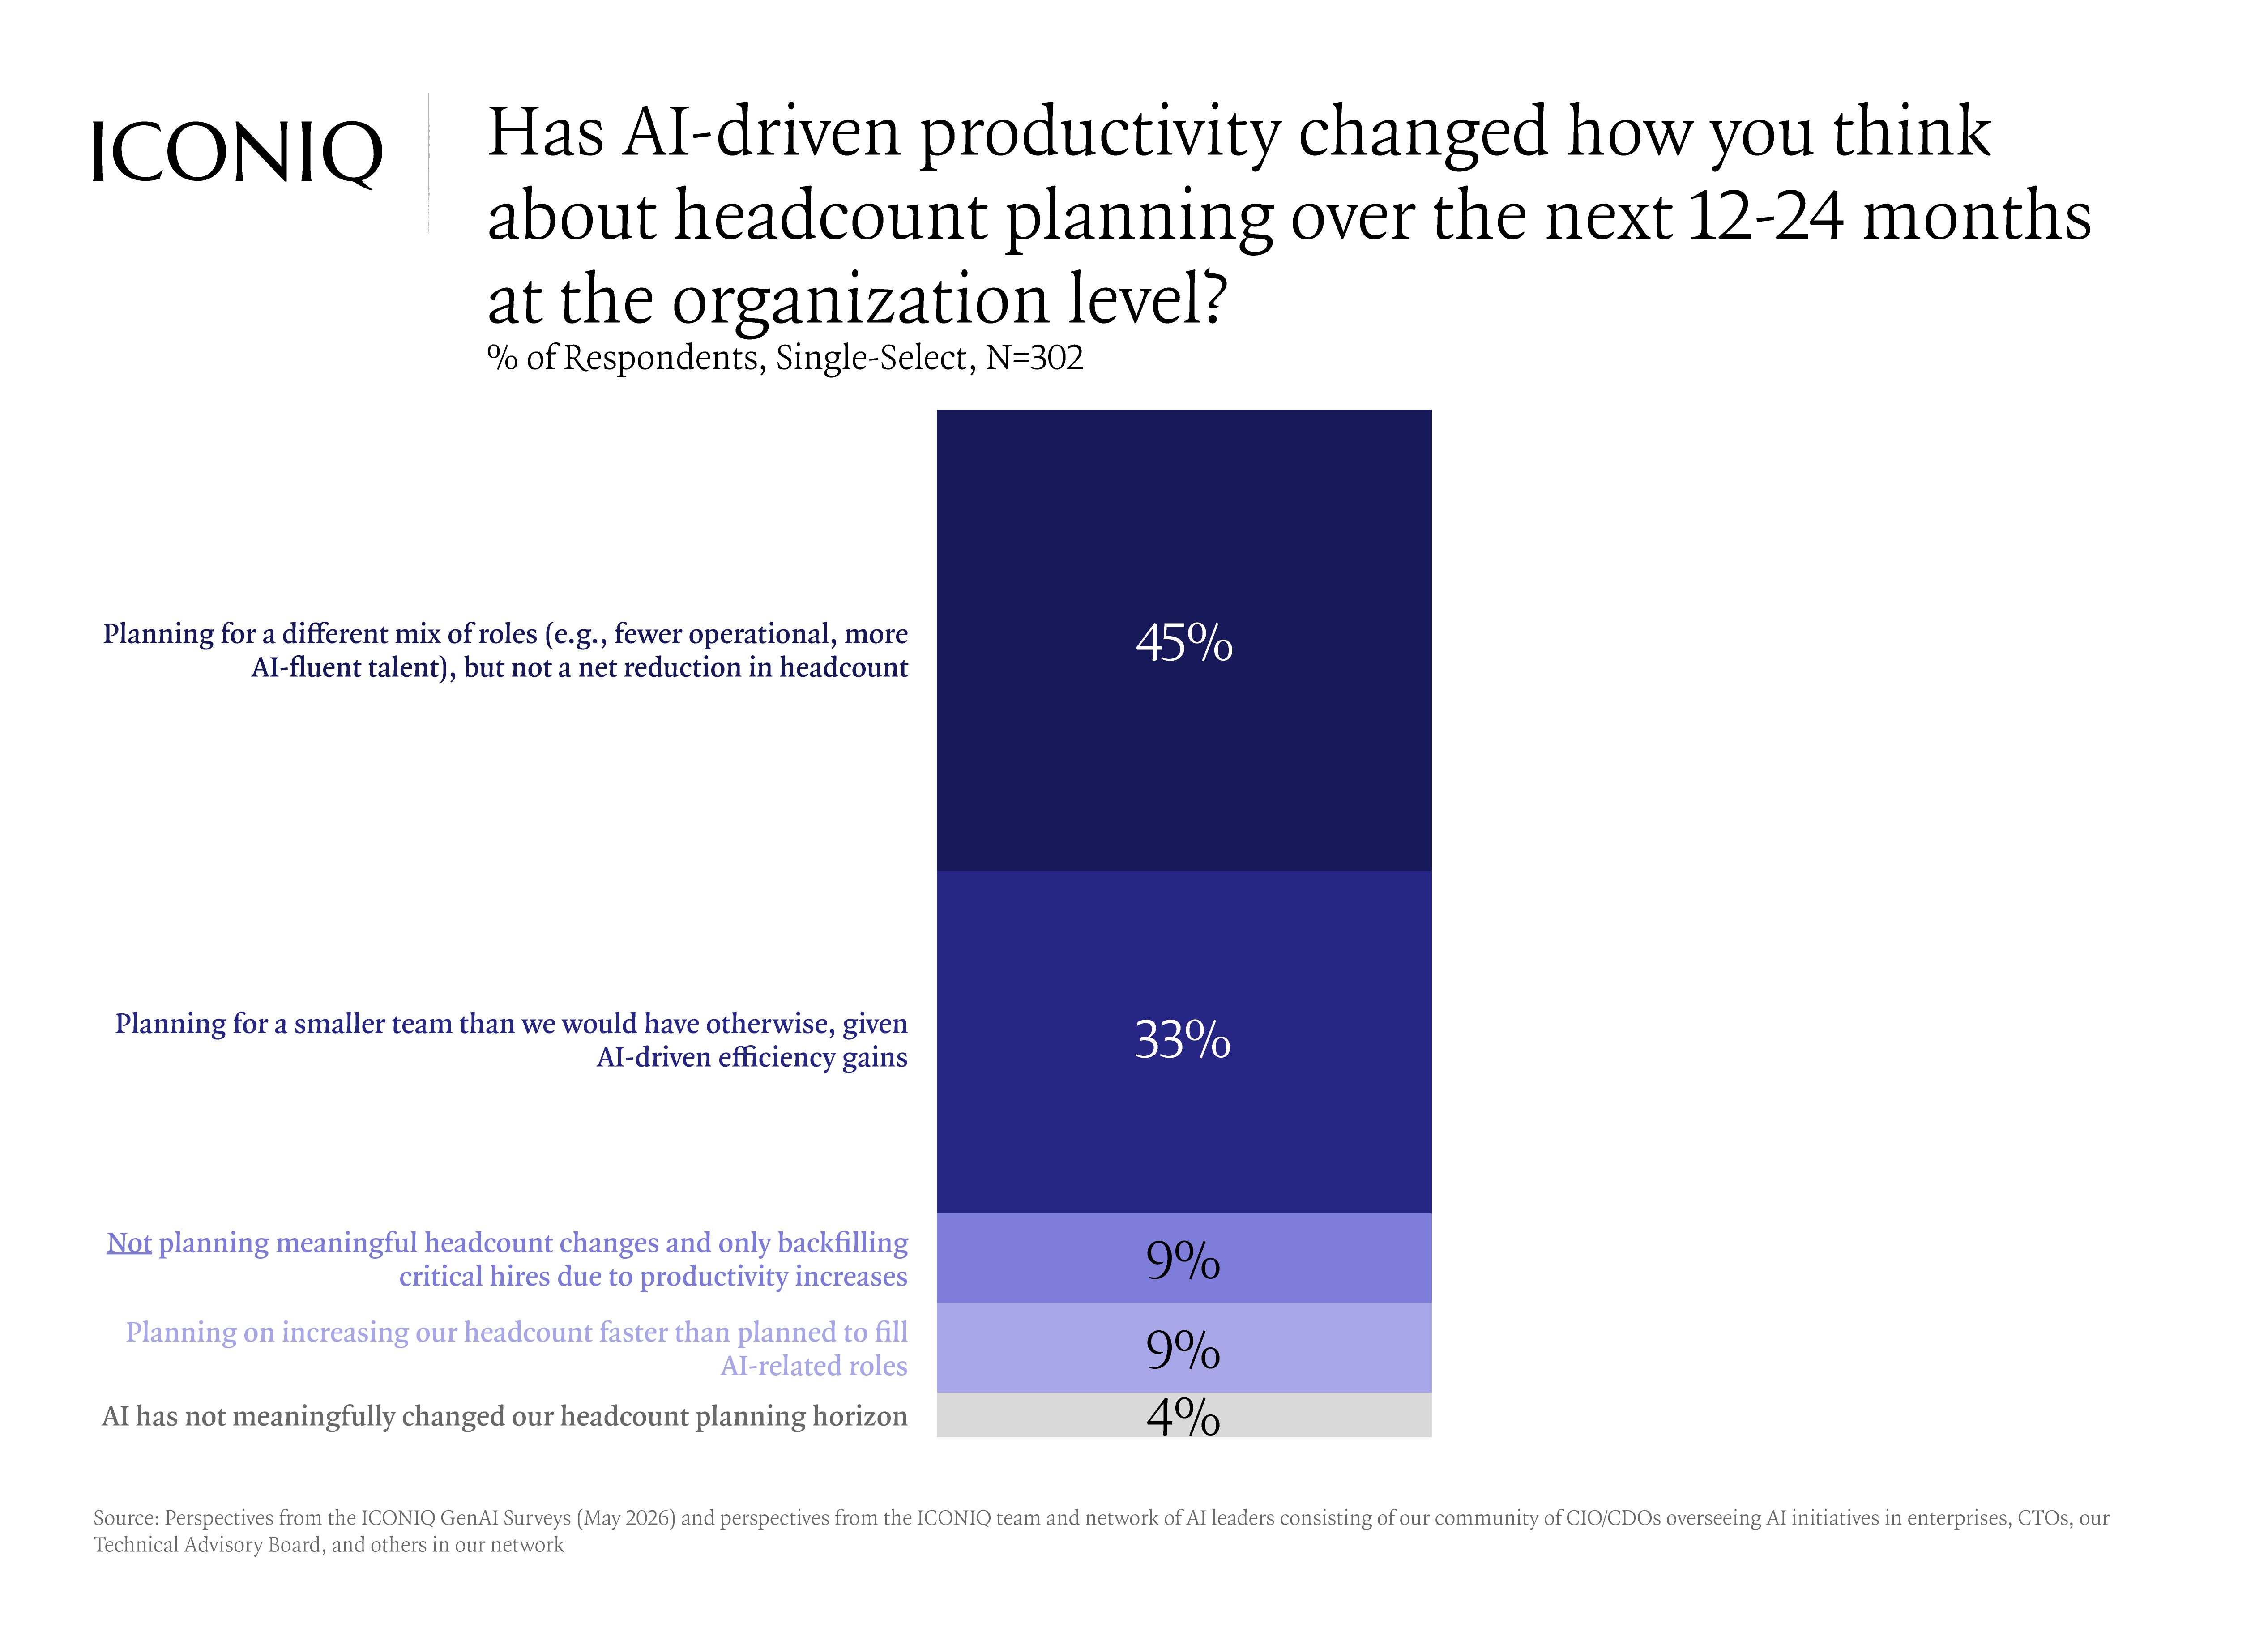
AI is changing how companies are built as much as what they build. Seventy-eight percent of companies are rethinking workforce planning, with 45% expecting a different mix of roles and 33% expecting smaller teams. Companies that earn most of their revenue from AI run flatter, with 72% reporting four or fewer management layers between the CEO and the most junior individual contributor, versus 56% of other peers. Read more about key themes centered around how AI companies are redesigning their organizations in our “From Org Charts to Outcomes: The New Operating Model for Talent” article.
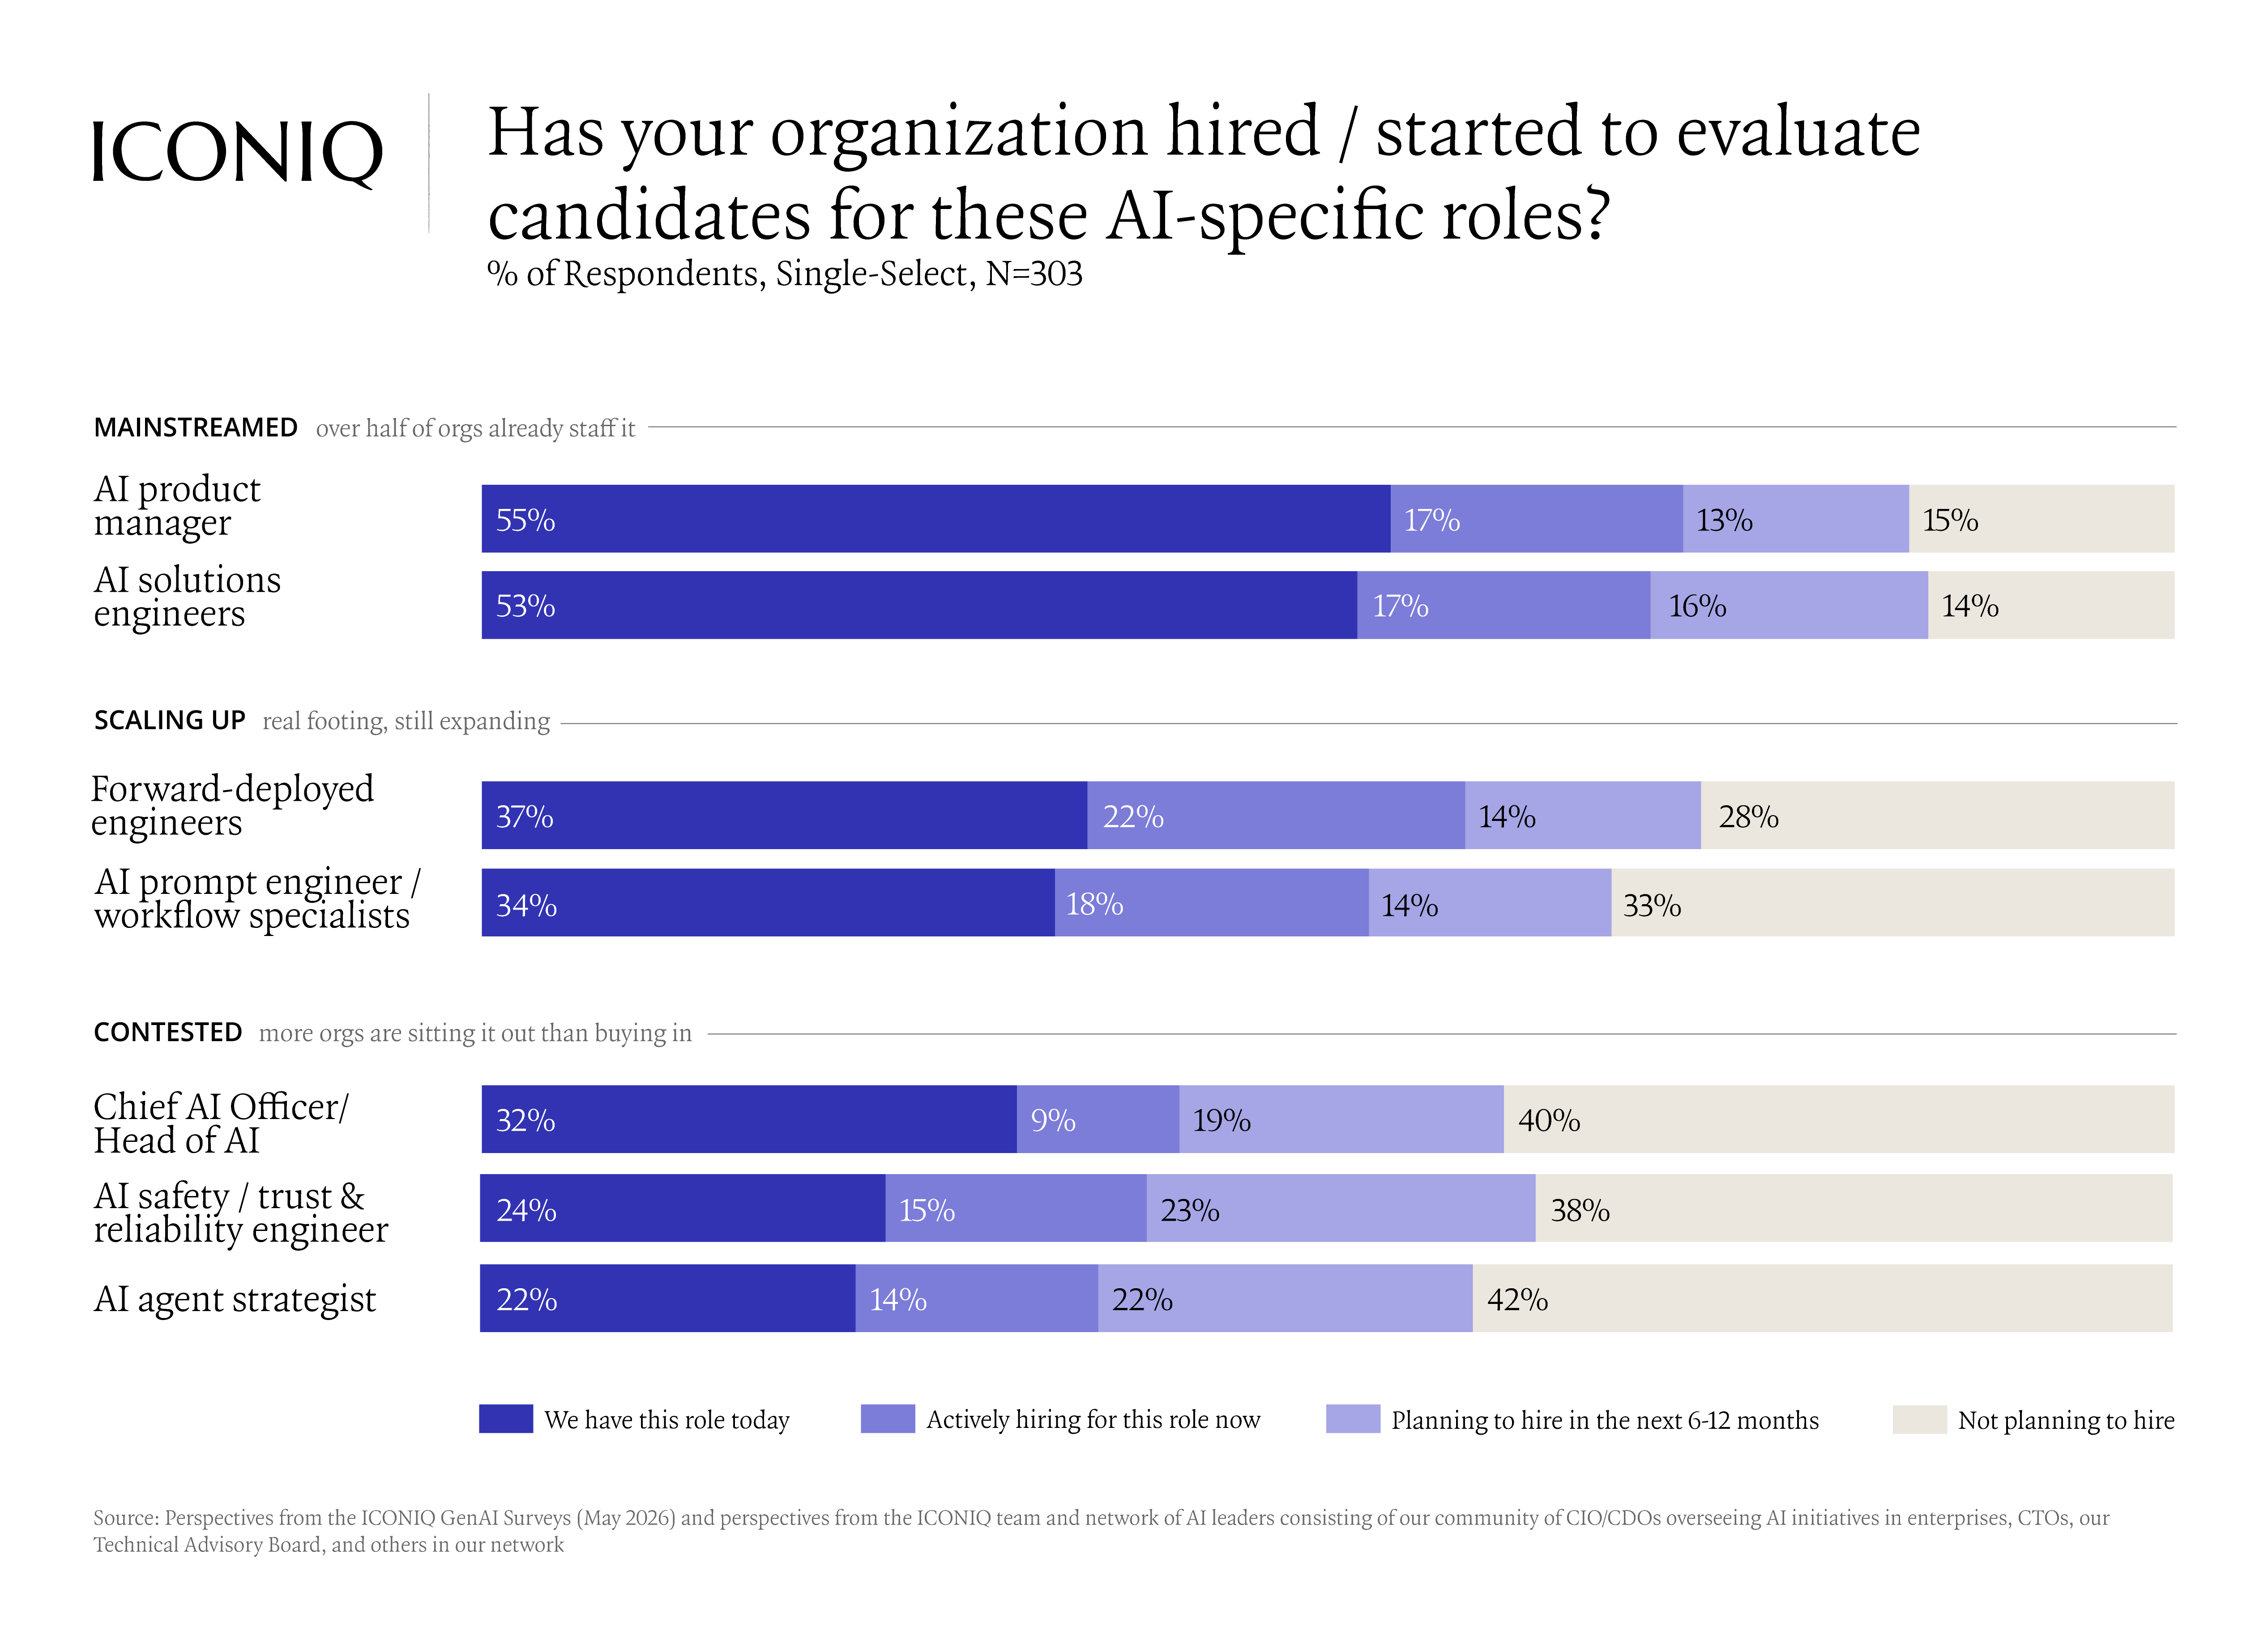
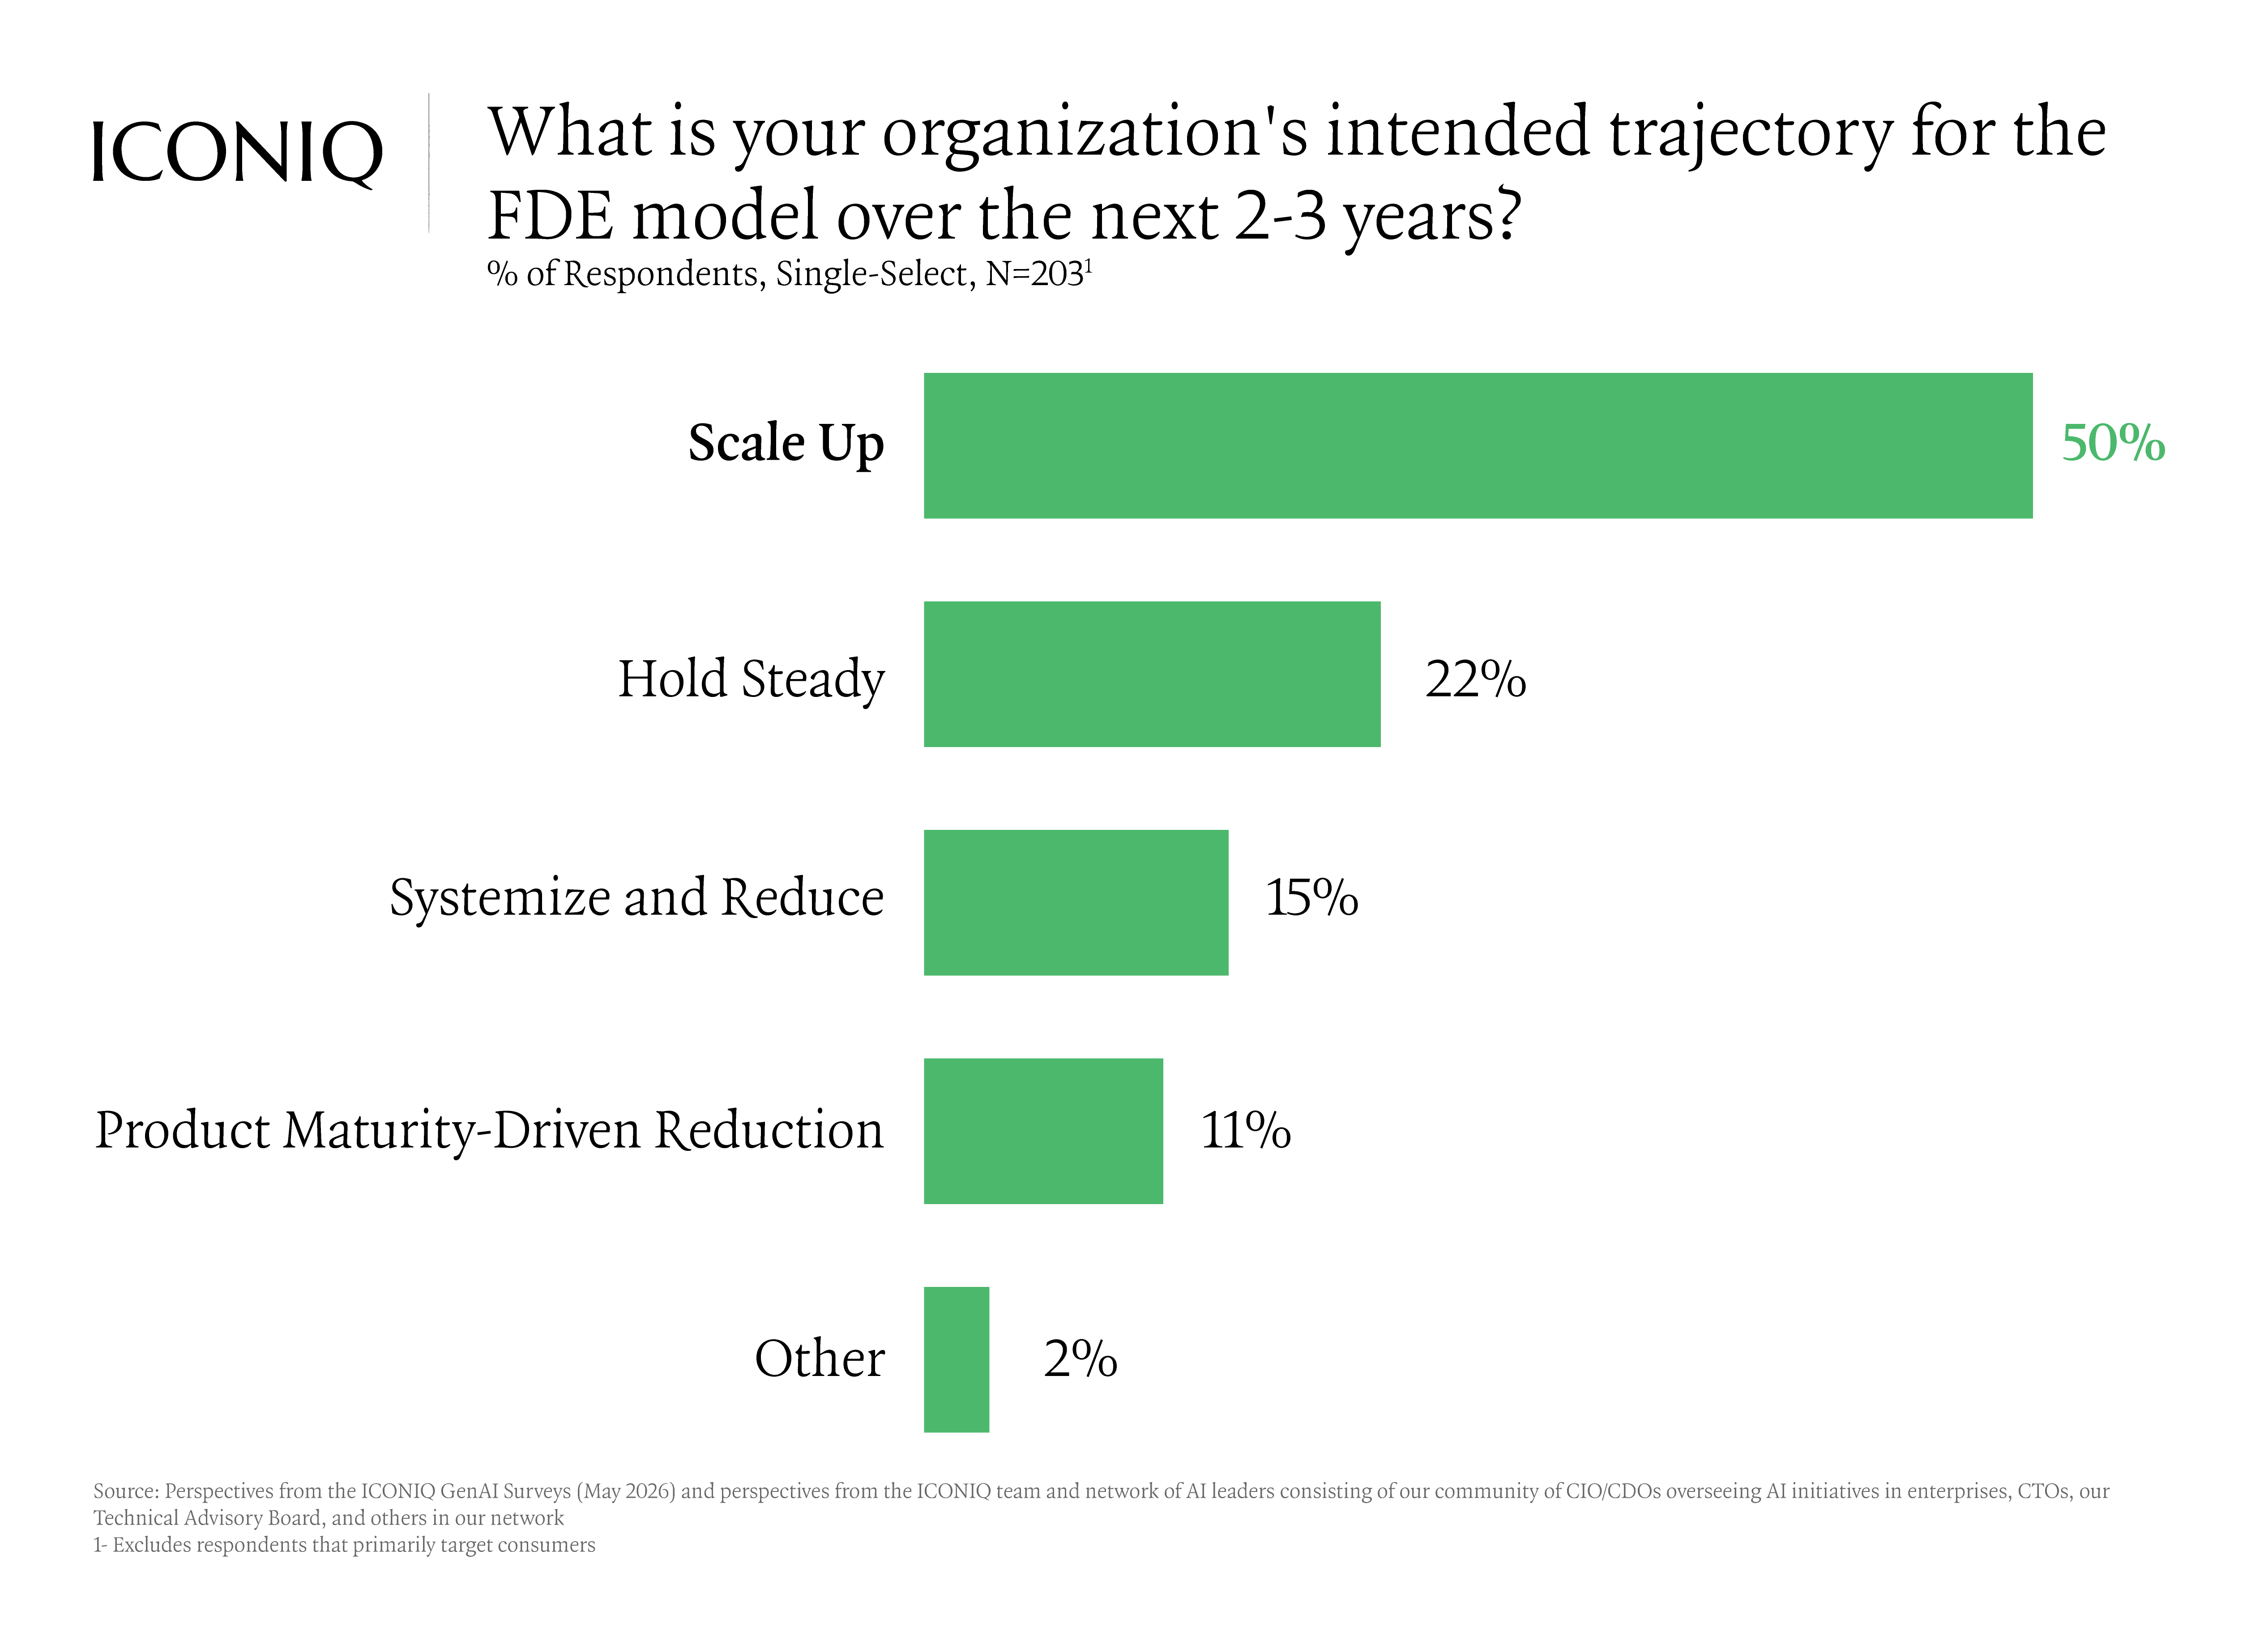
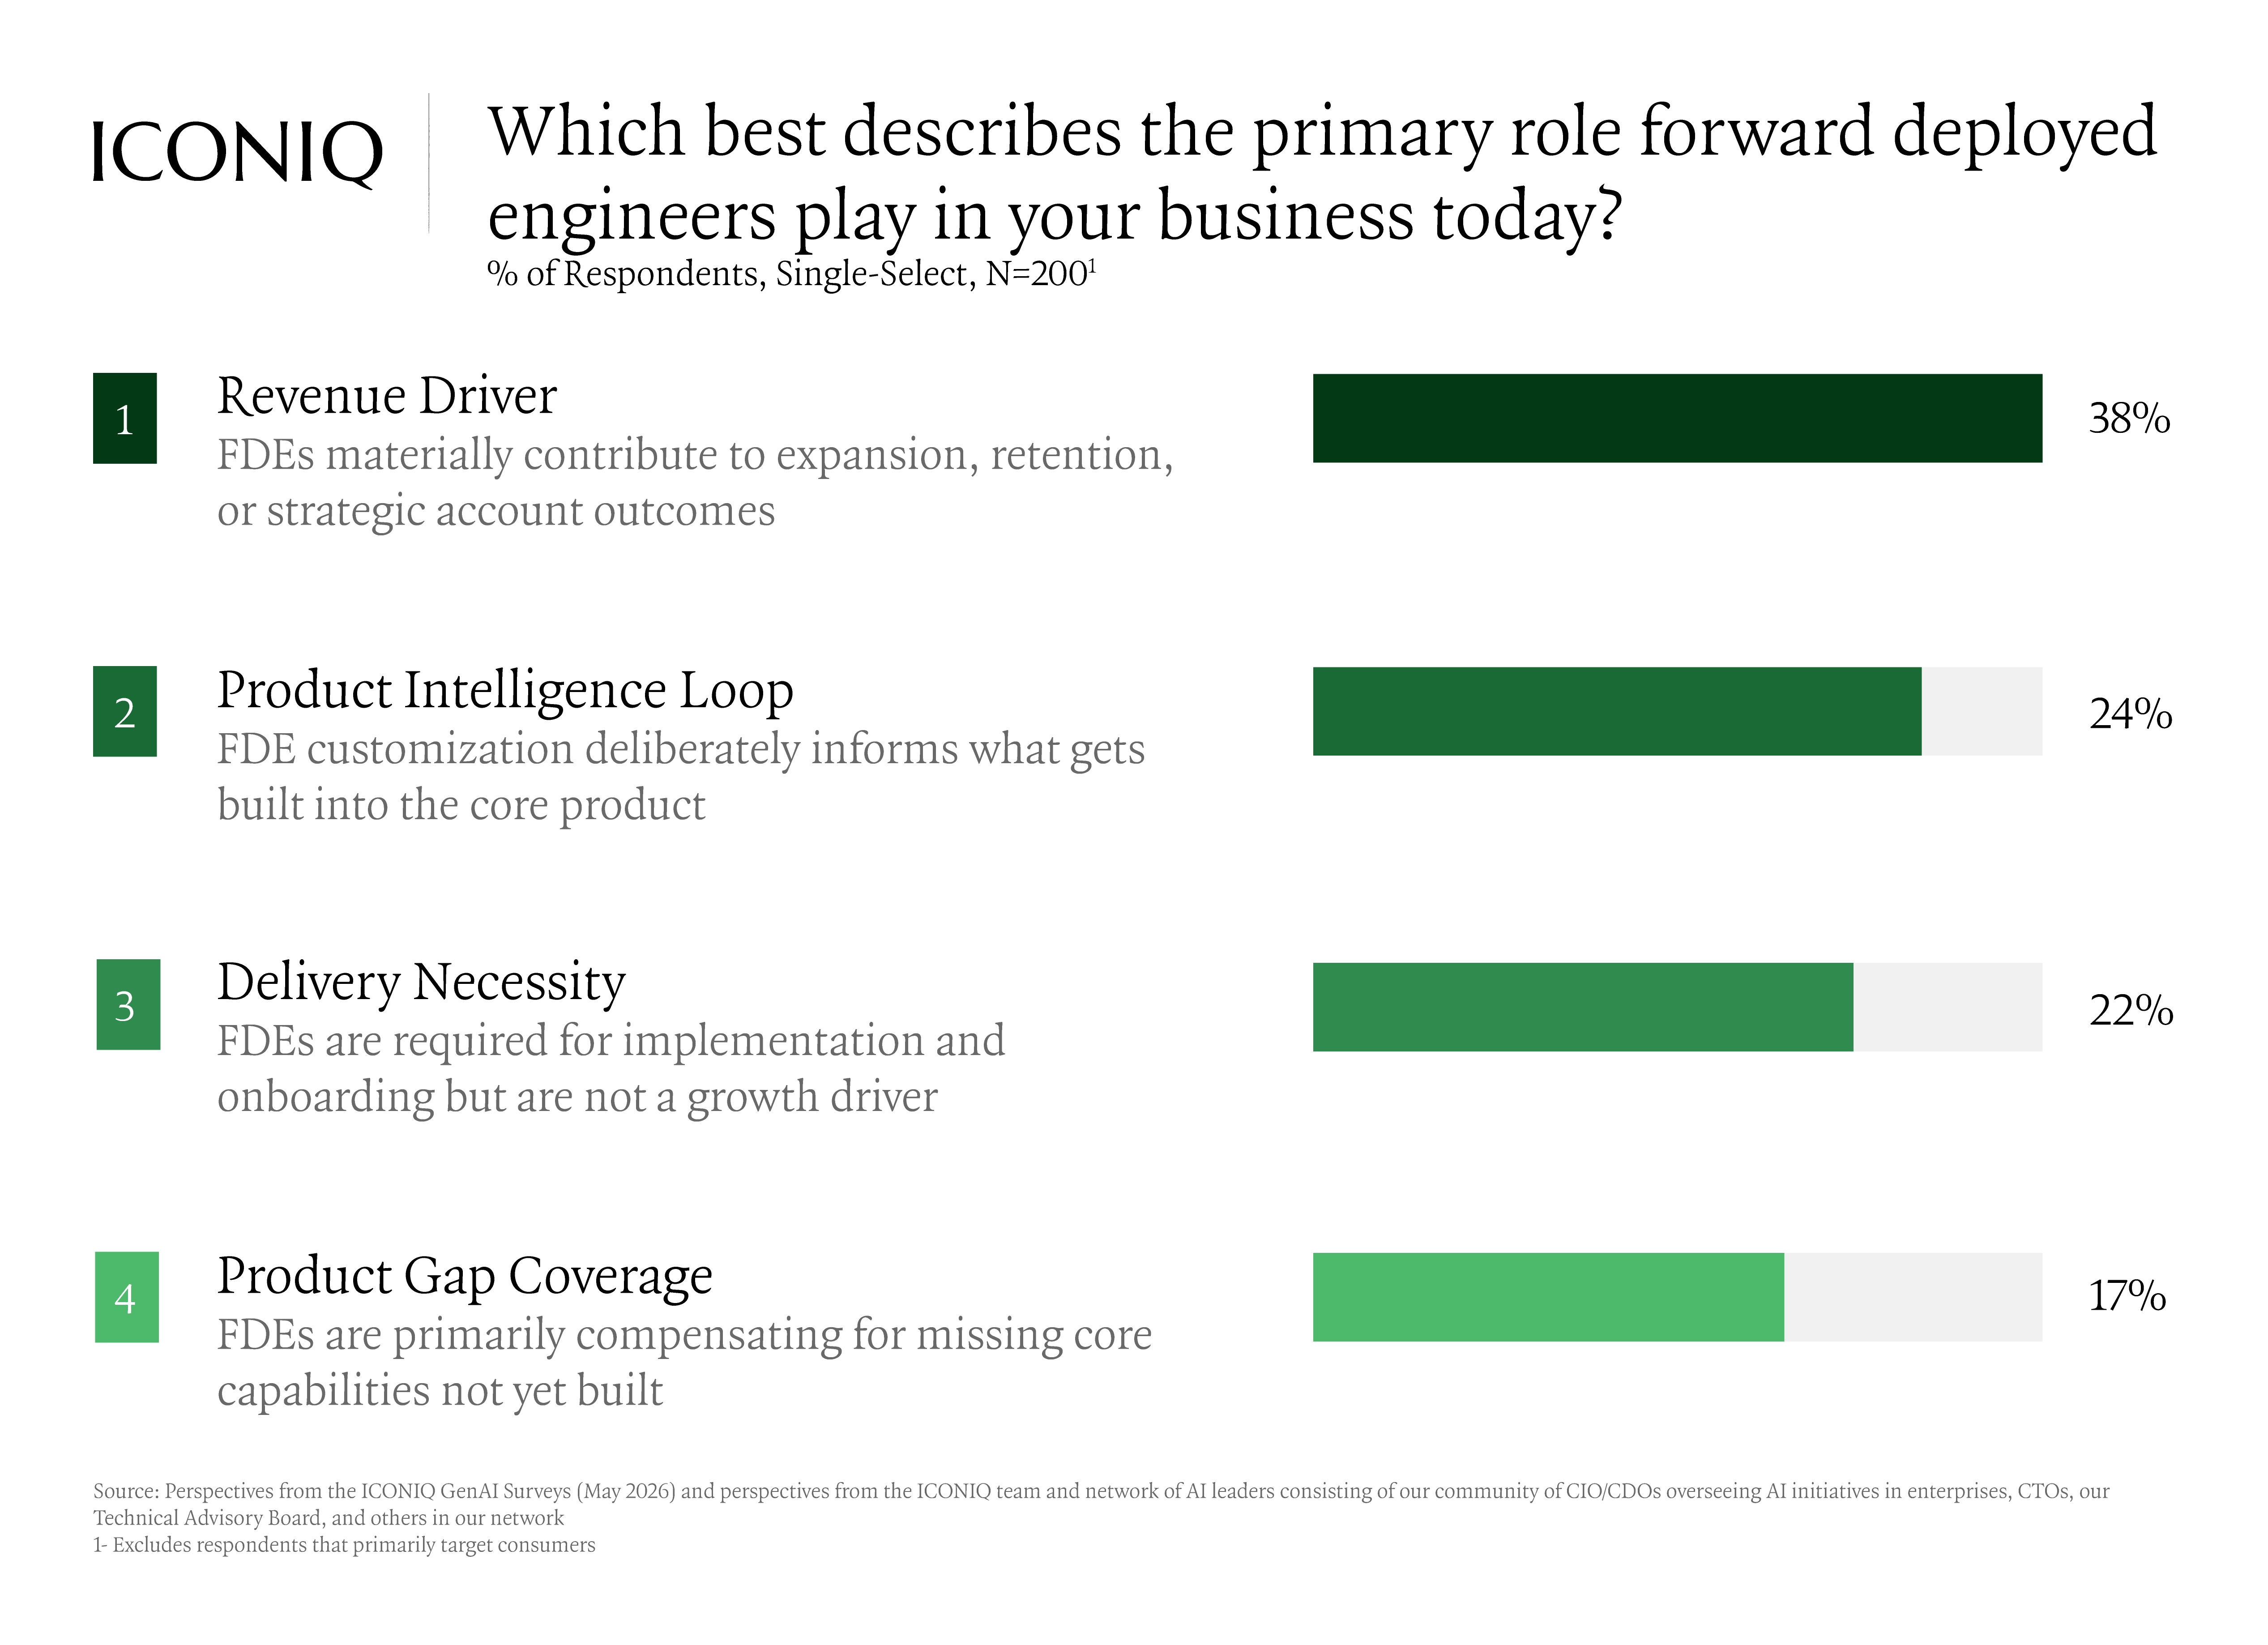
Growth is uneven by function, with R&D, sales, and product and design expanding, while customer support and G&A have contracted. Hiring follows suit: AI product managers and solutions engineers are now mainstream, while forward-deployed engineers and AI safety and reliability roles are scaling fastest. The forward-deployed engineer has graduated from a services patch to a permanent go-to-market motion, with half of companies planning to scale it and most treating it as a revenue role tied to expansion and retention.
This has become a live operating challenge rather than a planning question. The debate is less about how many engineers and more about which roles still create value. An engineer who turns a design doc into a feature is the most exposed, since AI already does much of that work well, while those who specialize in infrastructure and security, or operate as a product-engineering hybrid who can ship, have held their value.

How much do companies spend on internal AI, and is it working?
The companies that appear to be pulling ahead have integrated aI into workflows for compounding benefits.
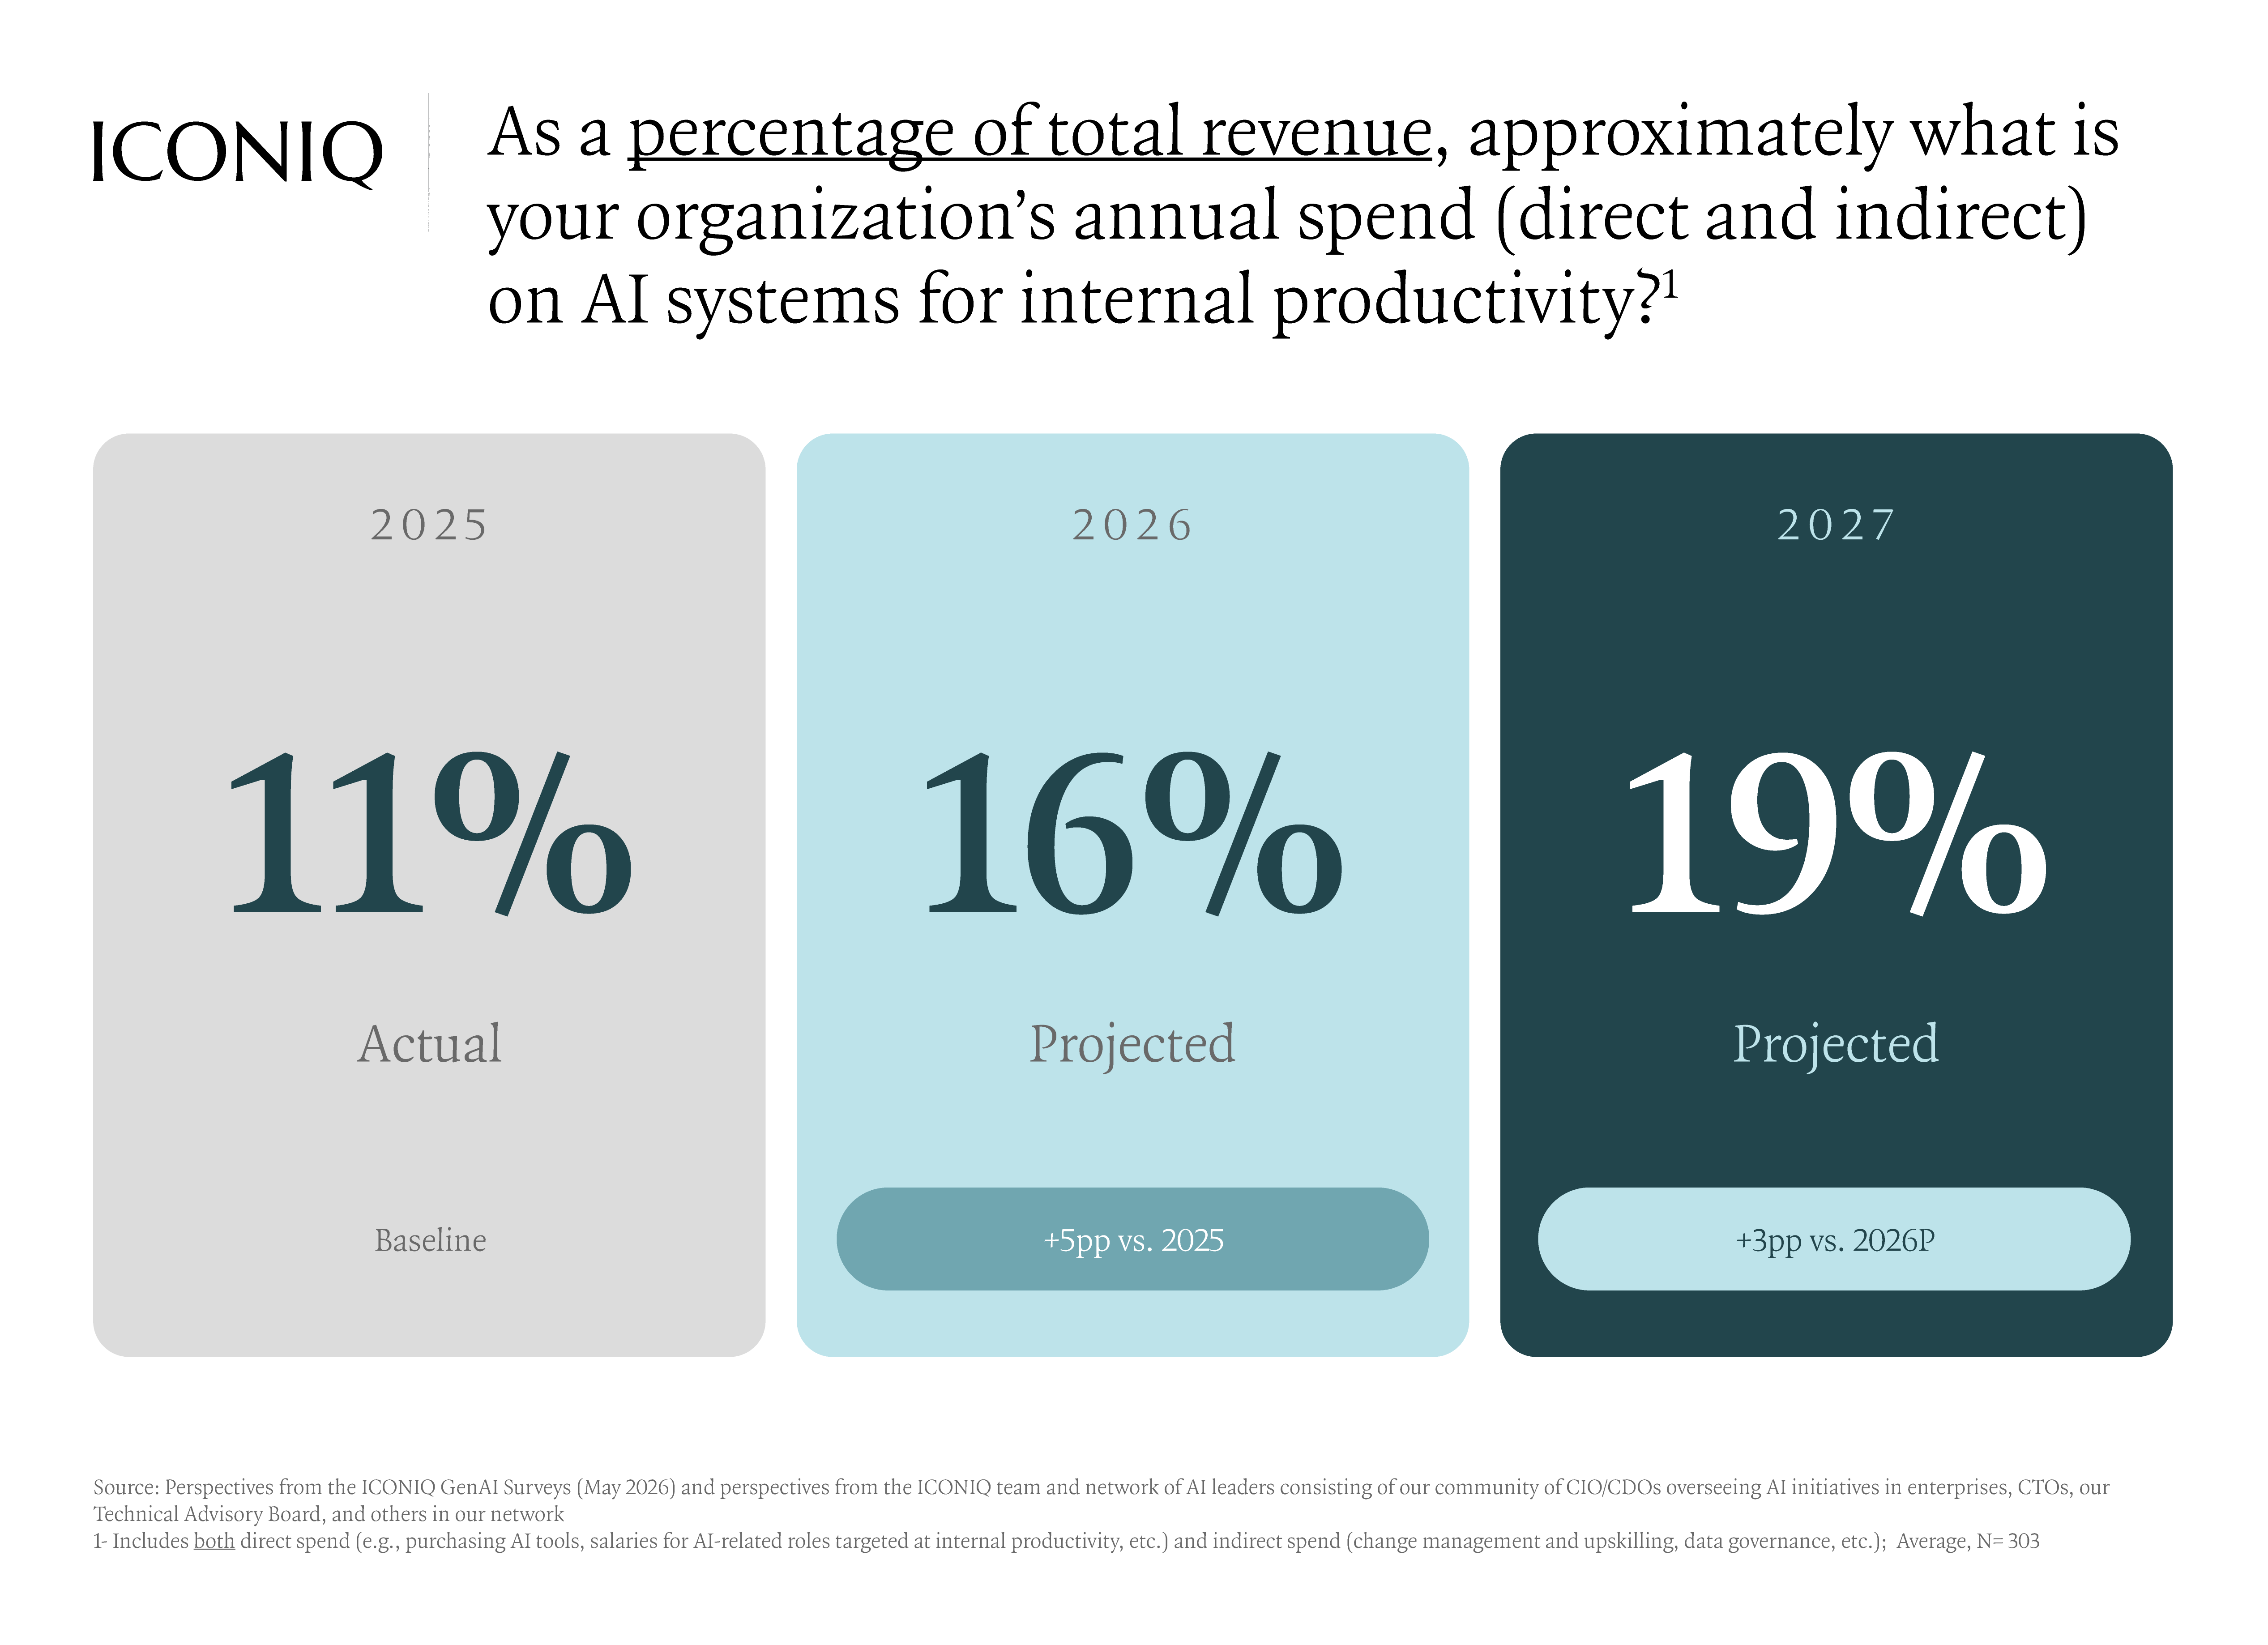
Spending on AI for internal productivity, including direct and indirect spend, is projected to rise from 11% of revenue in 2025 to 16% in 2026, heading toward 19% in 2027. And many companies underestimate the true cost.
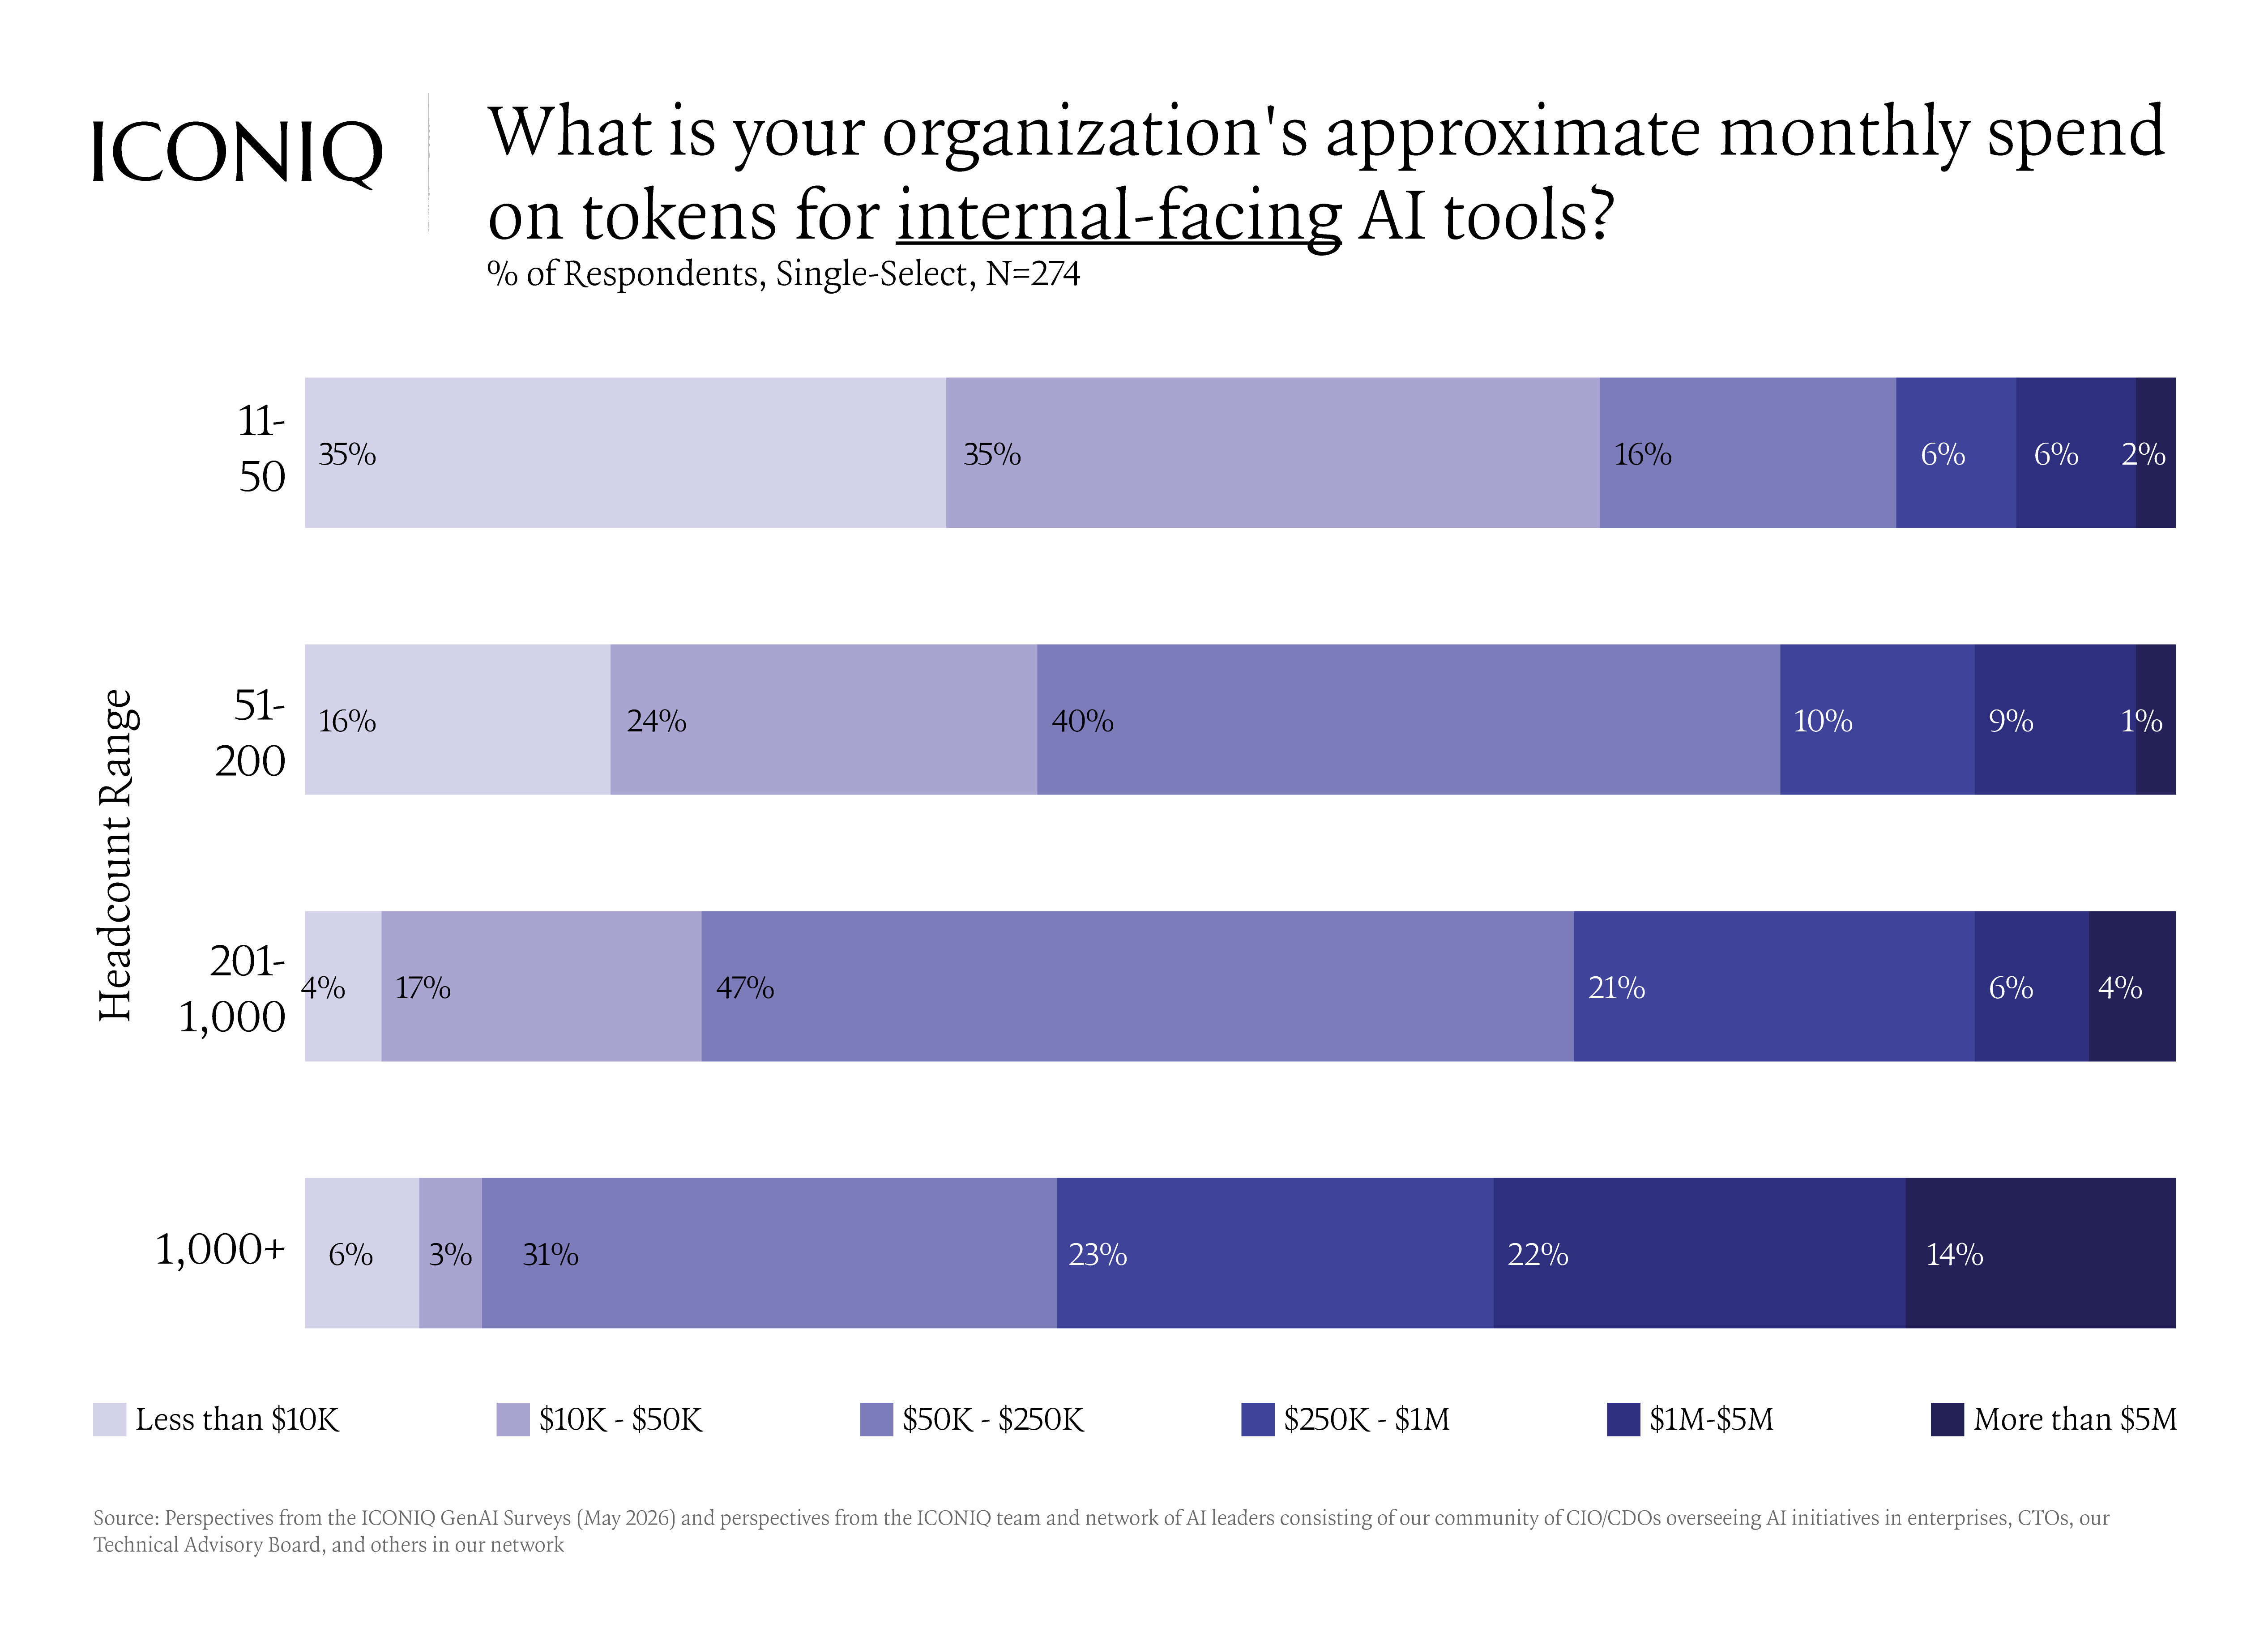
One of the biggest surprises came from token spend in agentic pipelines, where one builder watched a workflow budgeted at ten cents a run drift past a dollar fifty as agents retried and corrected themselves.
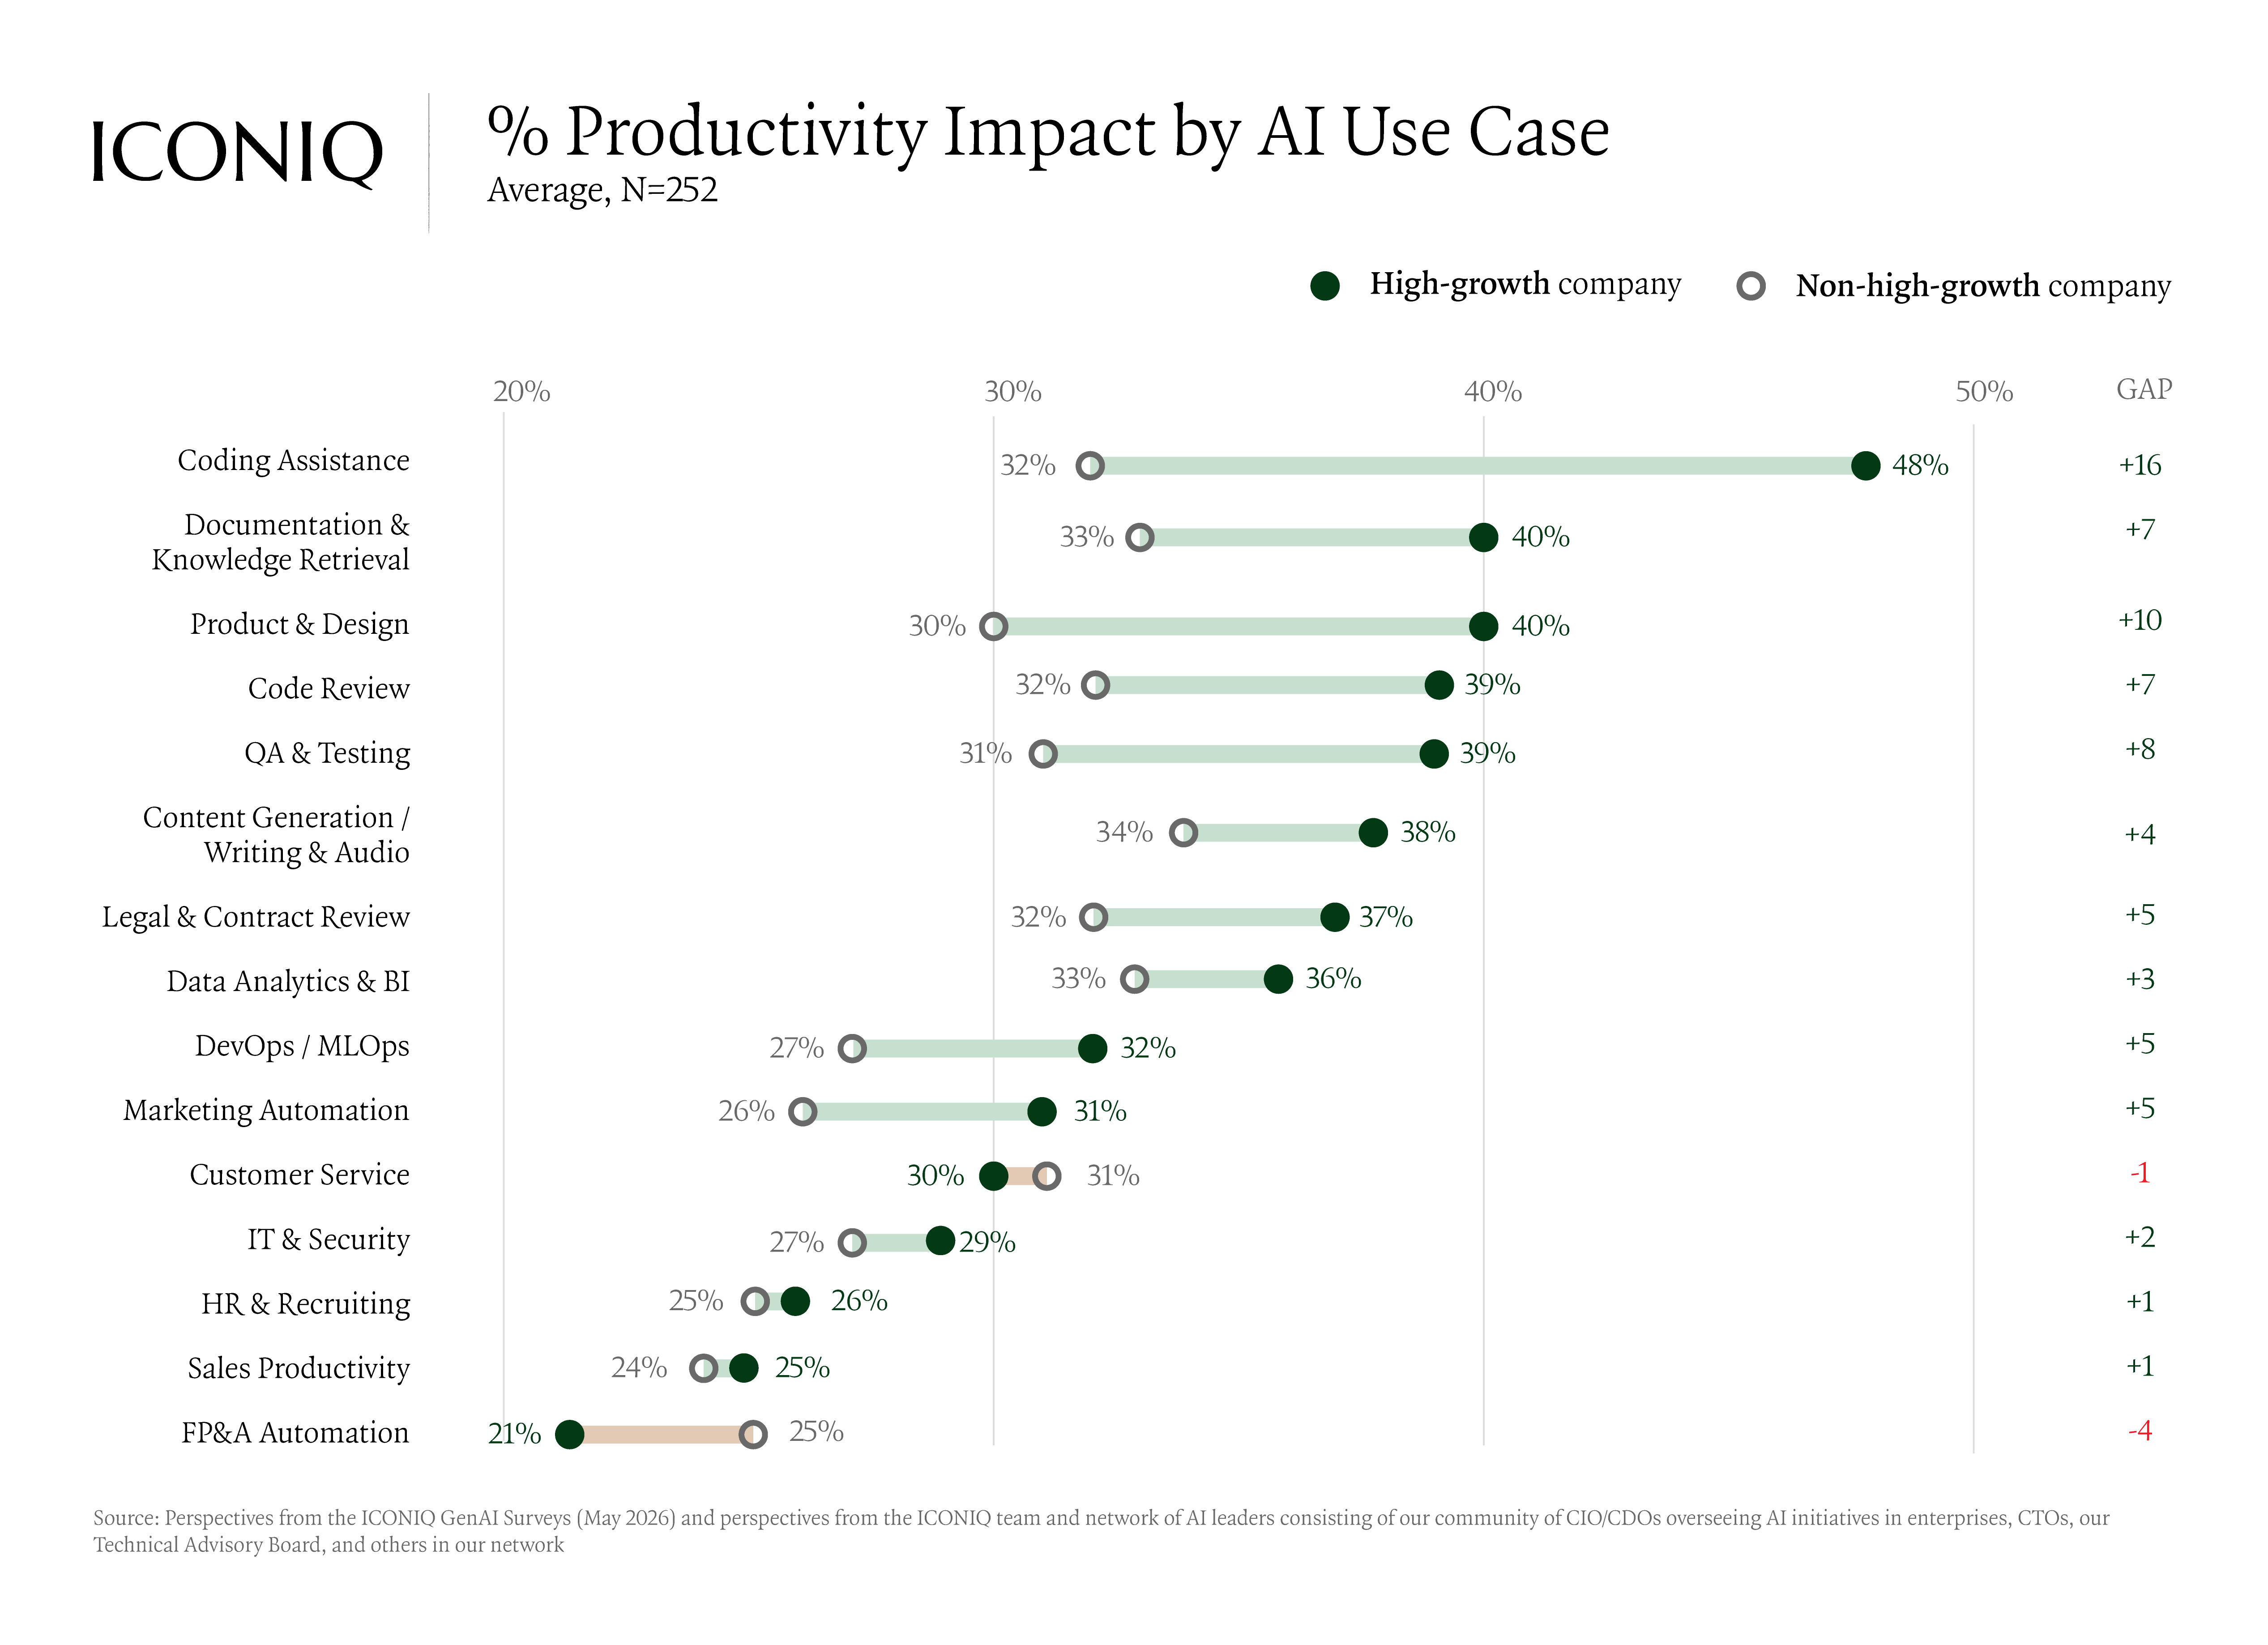
This is followed by data infrastructure and enablement. The high-growth advantage then shows up throughout the process: top performers stand up a new AI tool in about 2.5 months versus 3.5, write 59% of their code with AI versus 47%, and see 48% productivity gains from coding assistance vs 32%. and report a 16-point larger productivity gain from coding assistance, where their peers reach 48%. Each edge makes the next one easier to win.
Measuring token counts was also named as a poor success metric, since it distorts behavior. Charging usage back to cost centers works better, and traditional measures like cycle time and deploys per week still hold up as velocity proxies. One early-stage company runs the aggressive version, offering unlimited tokens, but managers owe three to five times the productivity and own delivery accountability. Top engineers there run up to $8,000 a day. Read more on how to measure success in the Age of AI in the “AI Adoption Index” template.
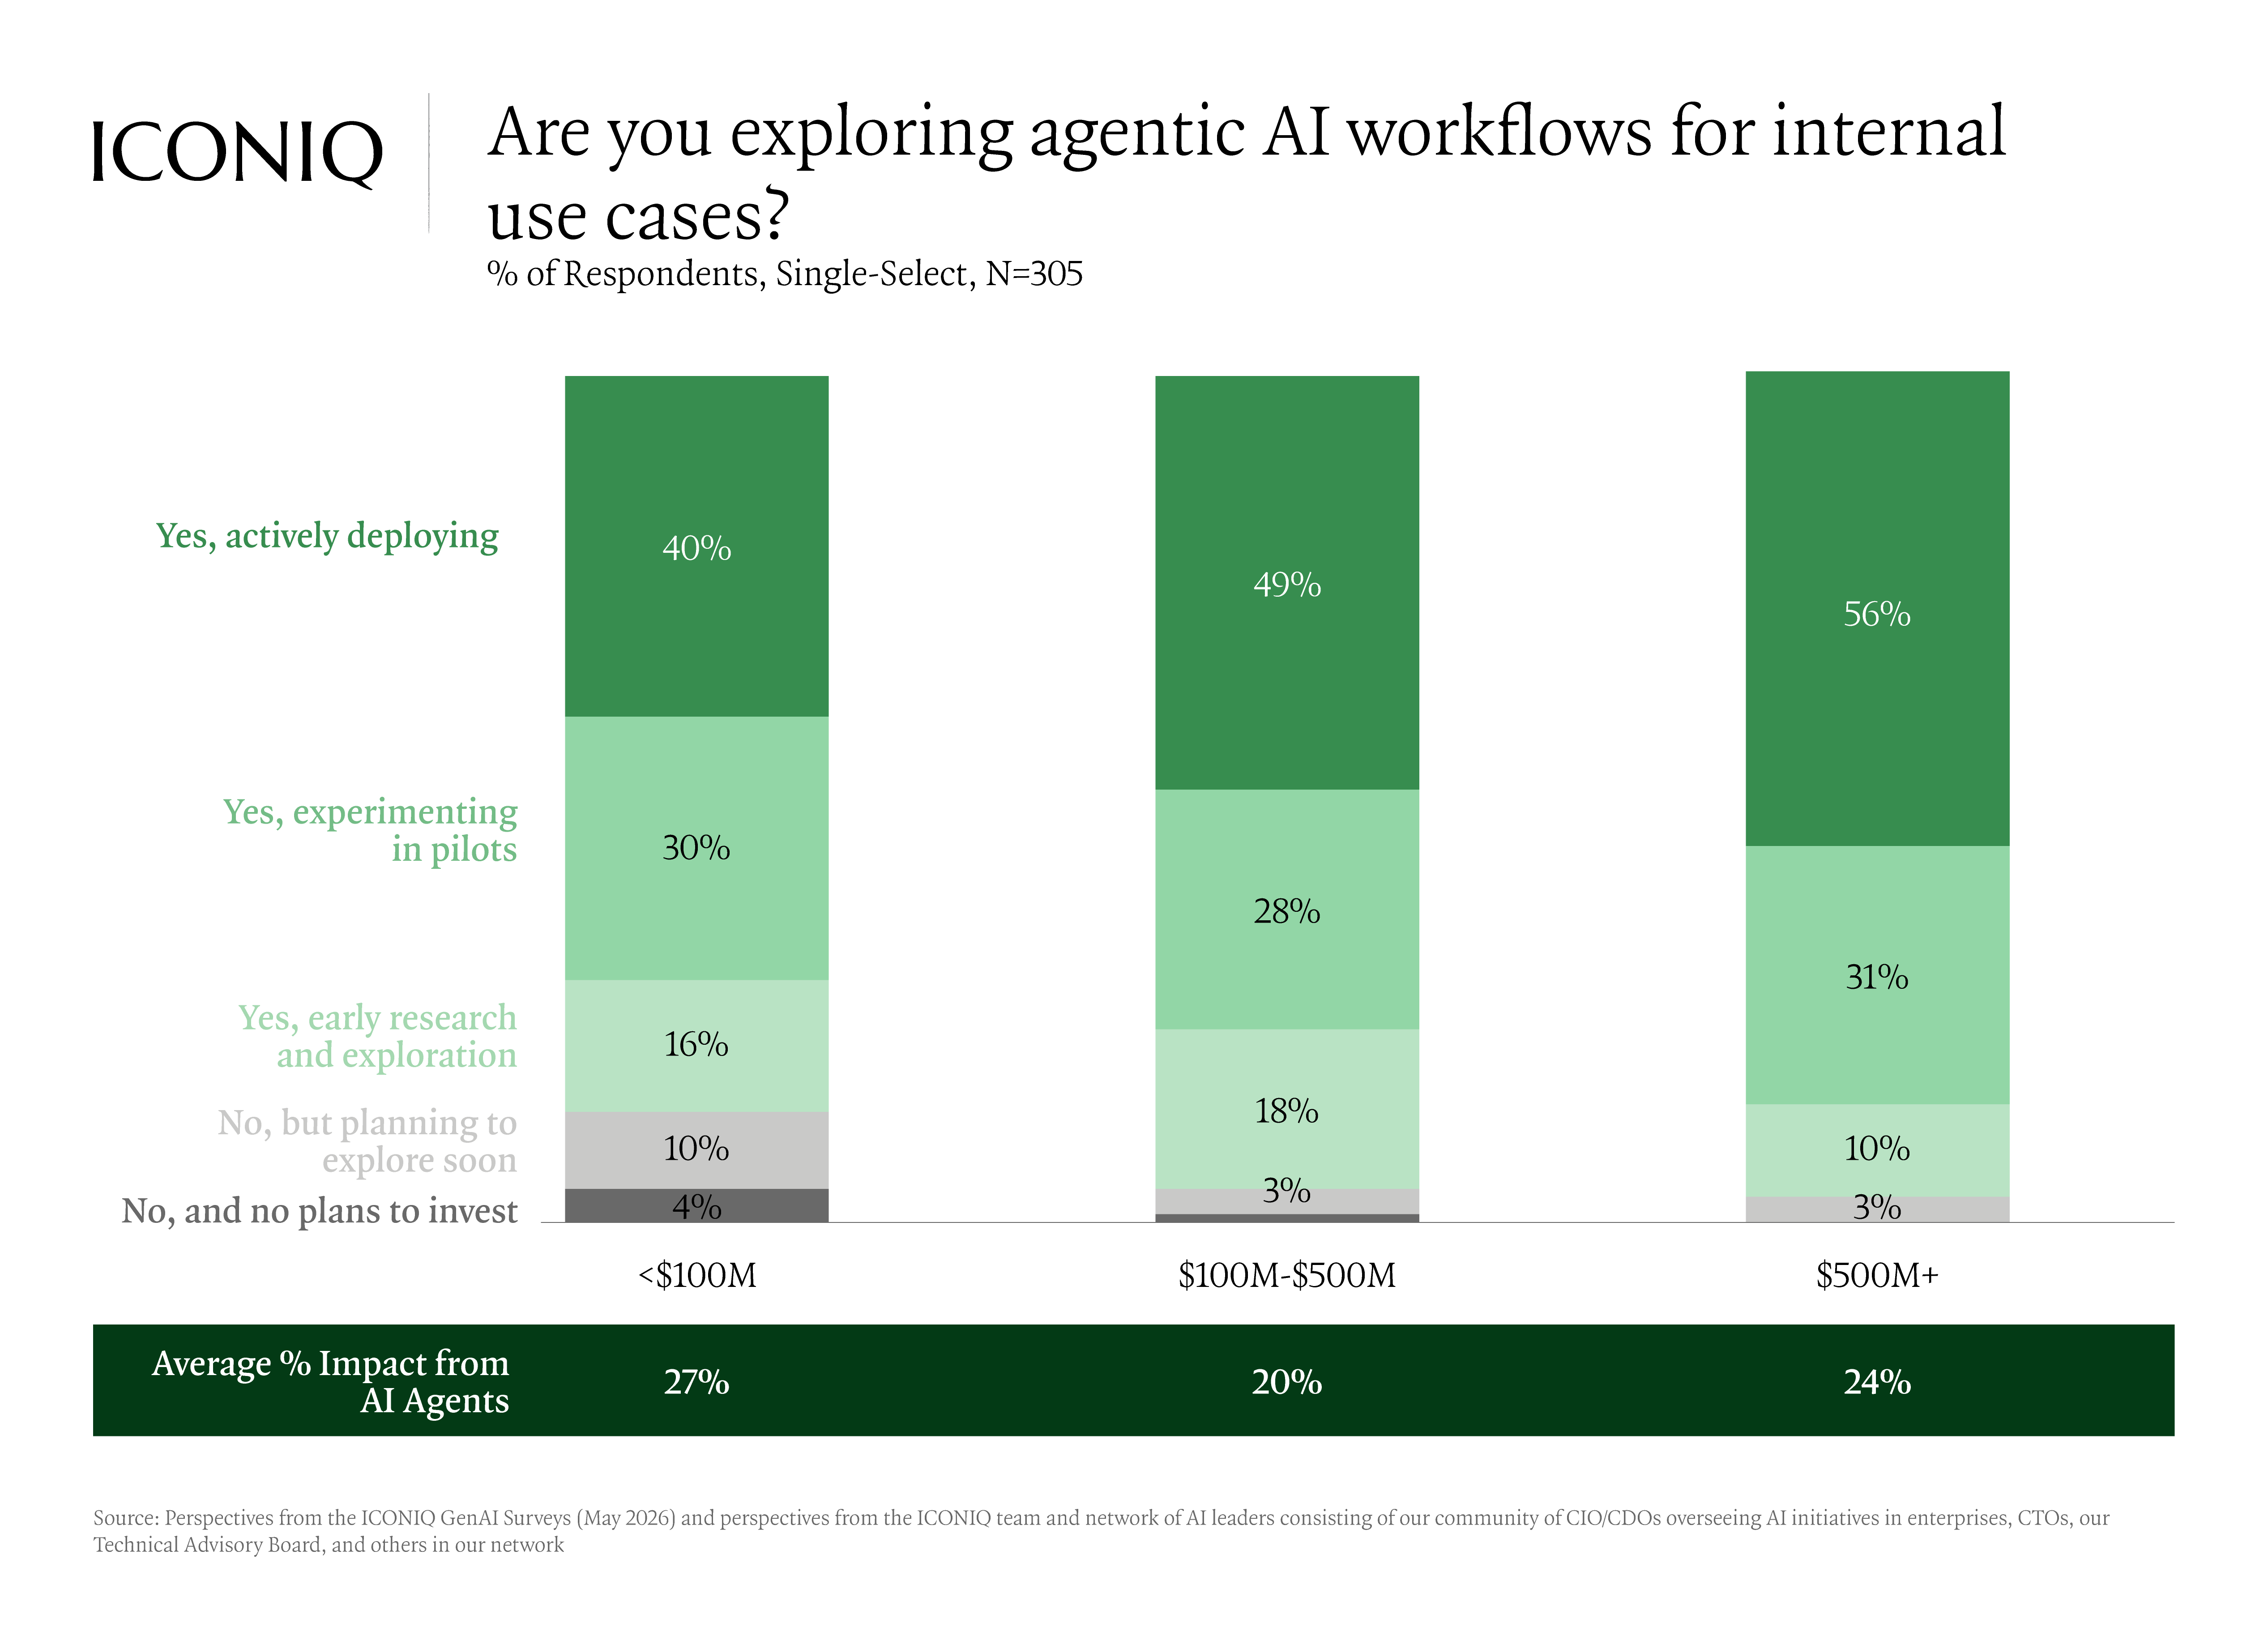
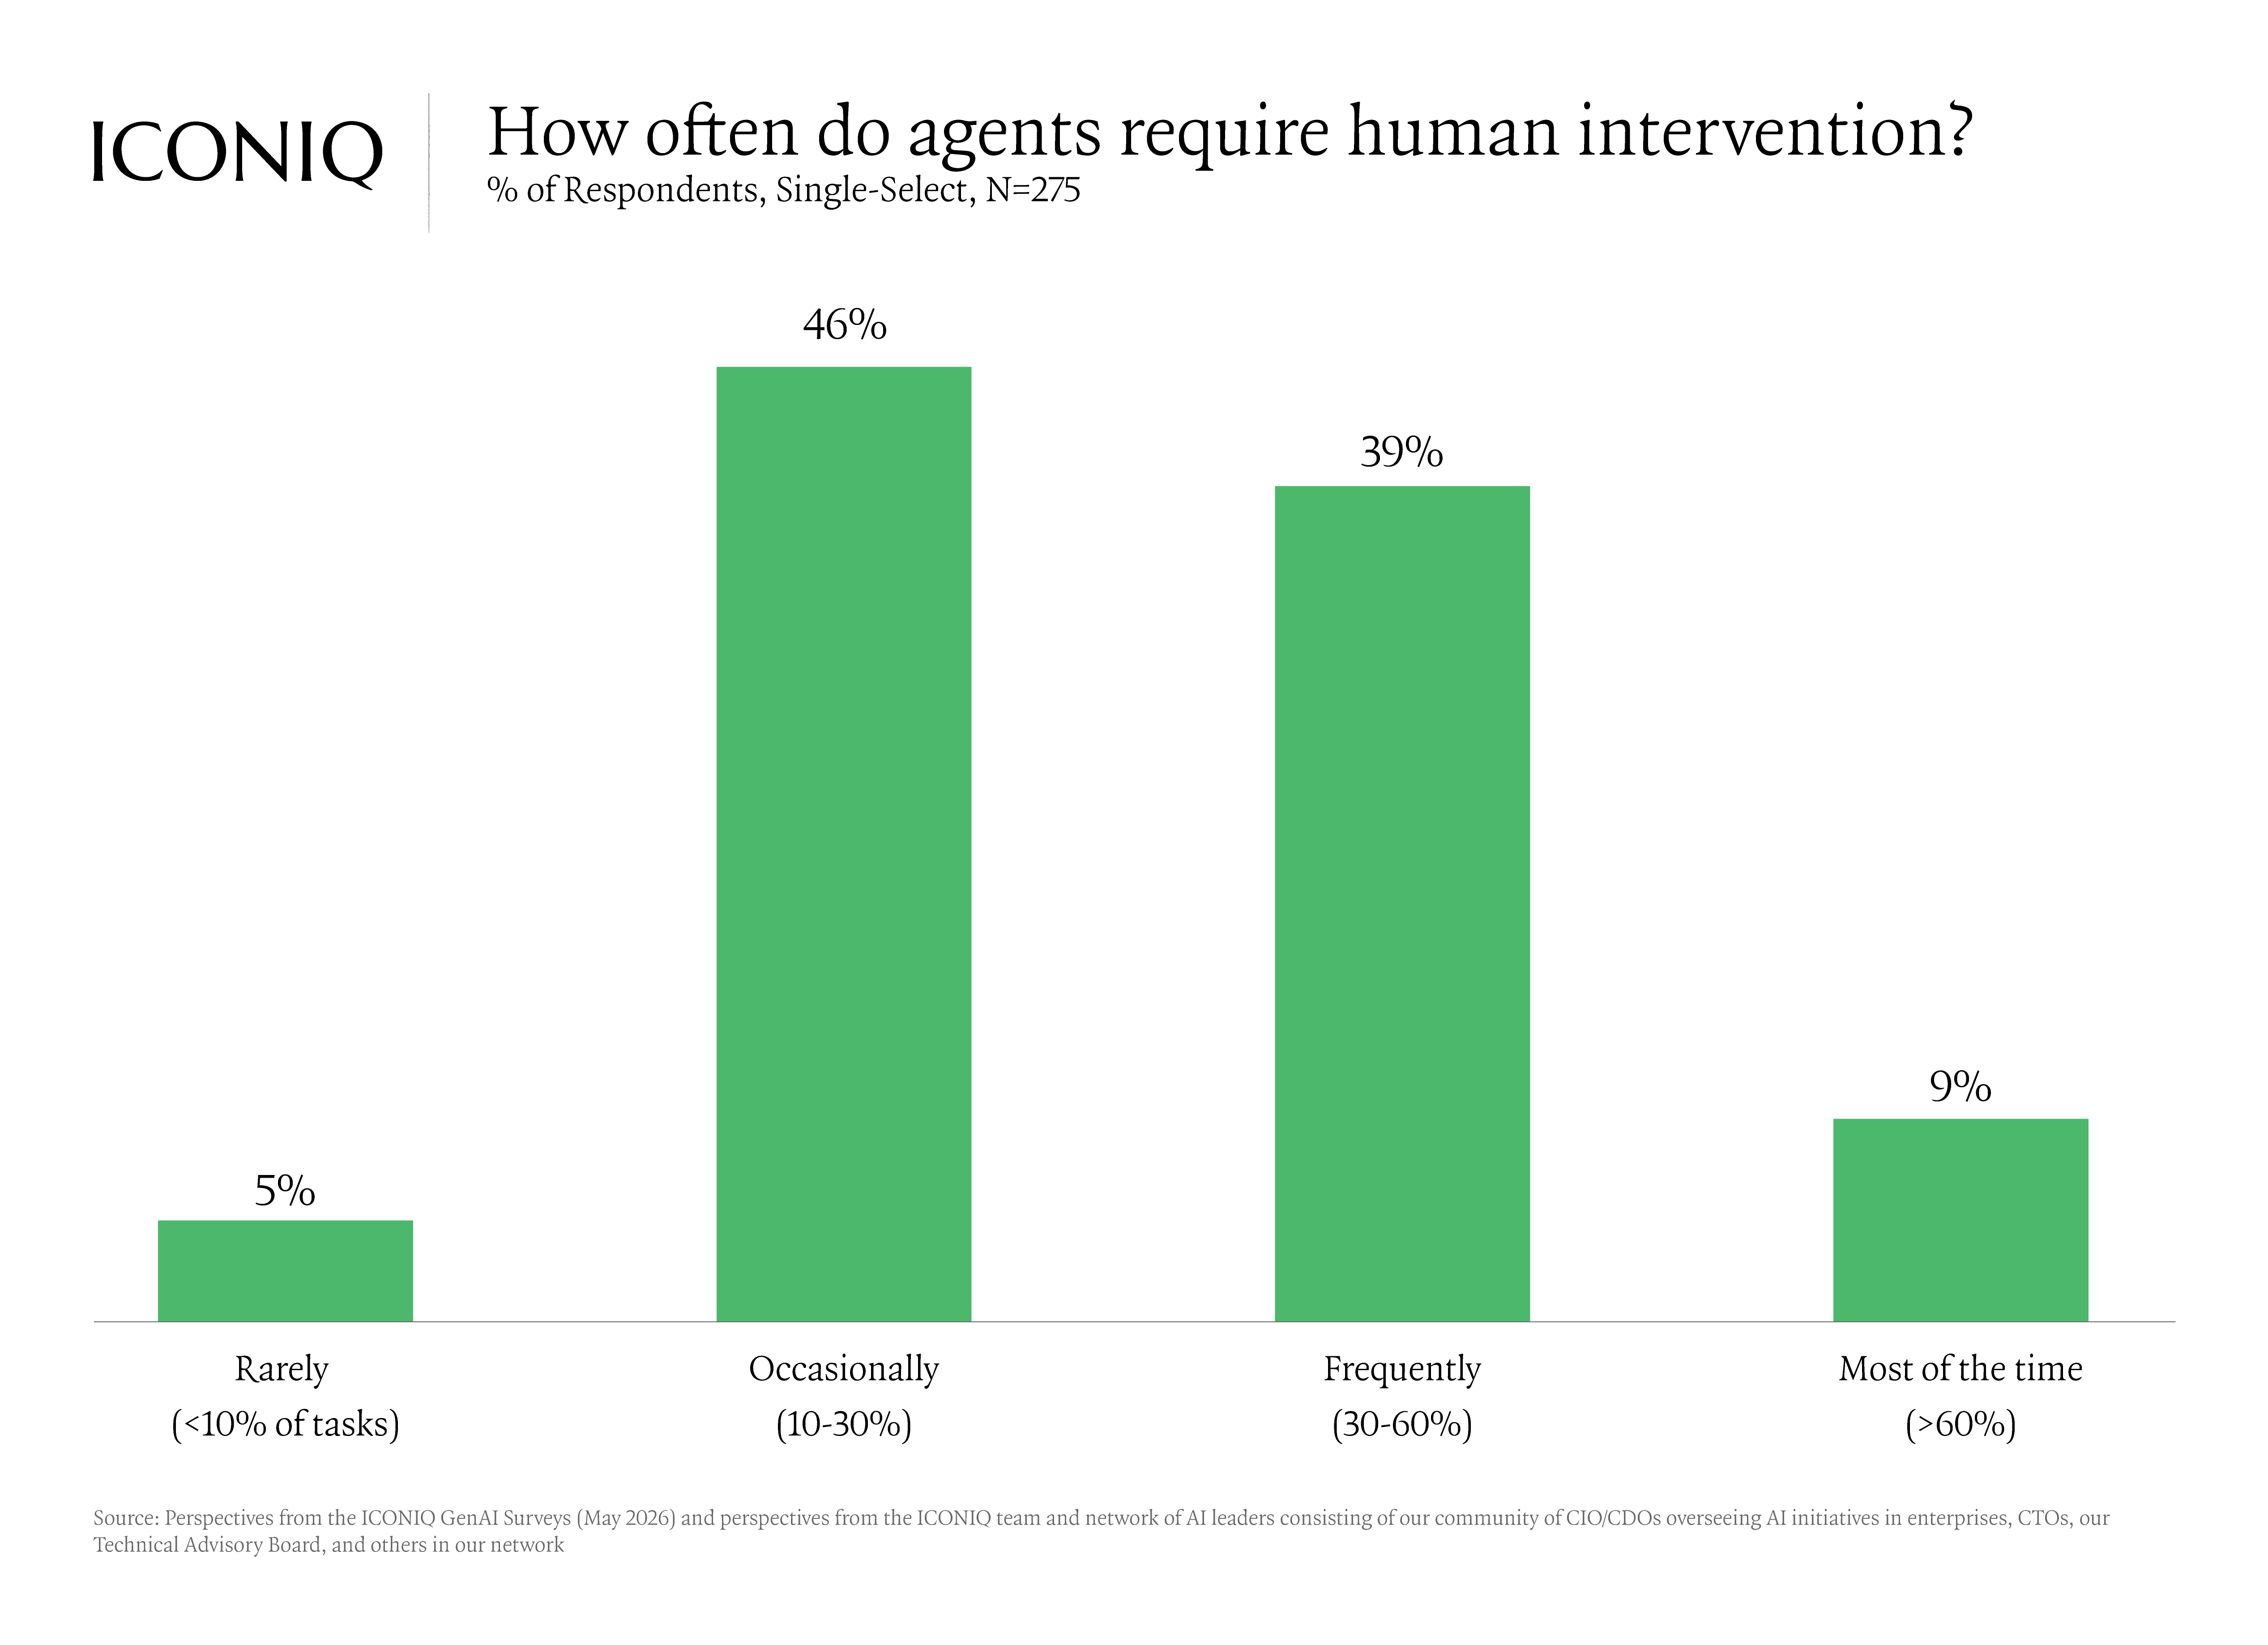
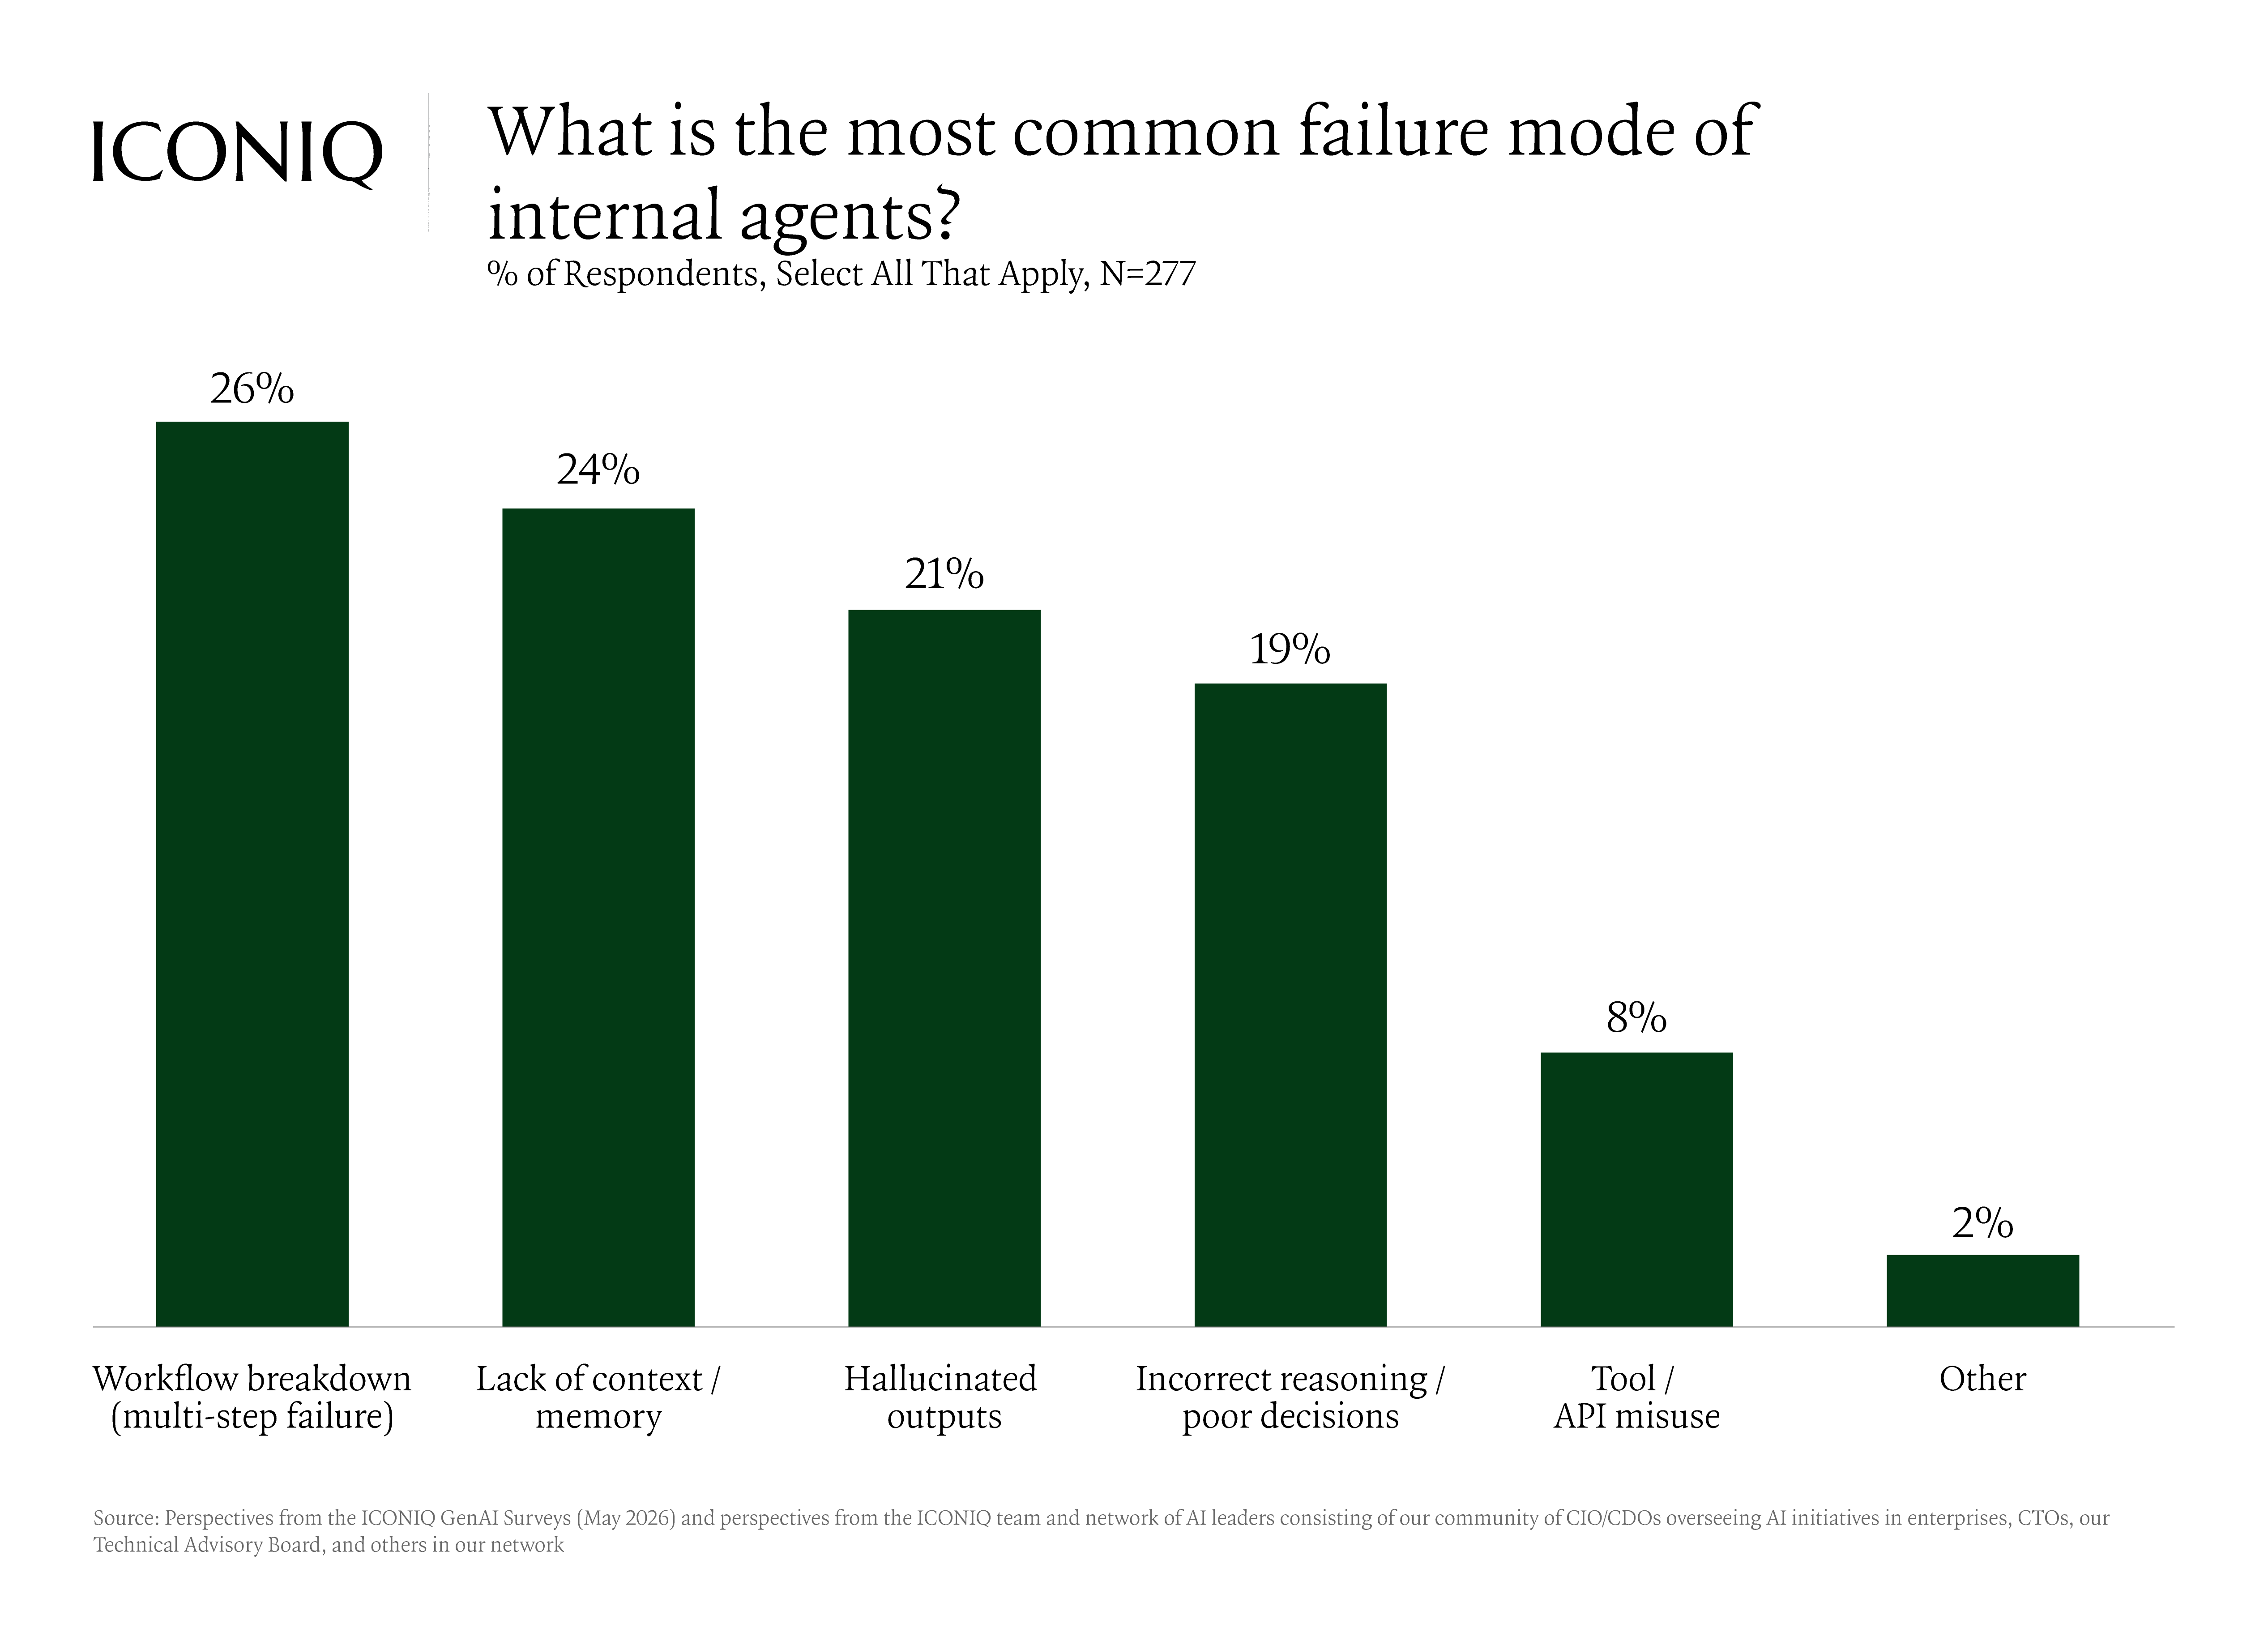
Agents are a clear test of how far internal AI has come. They have spread quickly, especially among larger companies, but average productivity gains sit below 30% across every revenue band. The gap is reliability. Almost half of companies say their agents still need a human to step in on at least 30% of tasks, and the most common failure is multi-step workflows that break partway through. The technology is real, but closing the distance between deploying an agent and trusting it unattended is what the next stage of development is about.
The companies pulling ahead in our survey have made pricing, cost structure, and organizational design into compounding advantages. The data shows how.
Download the full 2026 State of AI report for the complete picture.
Disclaimer
The views expressed in this presentation are those of ICONIQ Venture & Growth ("ICONIQ" or the "firm"), are the result of proprietary research, may be subjective, and may not be relied upon in making an investment decision.
This presentation is for general information purposes only and does not constitute investment advice. This presentation must not be relied upon in connection with any investment decision. The information in this presentation is not intended to and does not constitute financial, accounting, tax, legal, investment, consulting or other professional advice or services. Nothing in this presentation is or should be construed as an offer, invitation or solicitation to engage in any investment activity or transaction, including an offer to sell or a solicitation of an offer to buy any securities which should only be made pursuant to definitive offering documents and subscription agreements, including without limitation, any investment fund or investment product referenced herein.
Any reproduction or distribution of this presentation in whole or in part, or the disclosure of any of its contents, without the prior consent of ICONIQ, is strictly unauthorized.
This presentation may contain forward-looking statements based on current plans, estimates and projections. The recipient of this presentation ("you") are cautioned that a number of important factors could cause actual results or outcomes to differ materially from those expressed in, or implied by, the forward-looking statements. The numbers, figures and case studies included in this presentation have been included for purposes of illustration only, and no assurance can be given that the actual results of ICONIQ or any of its partners and affiliates will correspond with the results contemplated in the presentation. No information is contained herein with respect to conflicts of interest, which may be significant. The portfolio companies and other parties mentioned herein may reflect a selective list of the prior investments made by ICONIQ.
Certain of the economic and market information contained herein may have been obtained from published sources and/or prepared by other parties. While such sources are believed to be reliable, none of ICONIQ or any of its affiliates and partners, employees and representatives assume any responsibility for the accuracy of such information.
All of the information in the presentation is presented as of the date made available to you (except as otherwise specified), and is subject to change without notice, and may not be current or may have changed (possibly materially) between the date made available to you and the date actually received or reviewed by you. ICONIQ assumes no obligation to update or otherwise revise any information, projections, forecasts or estimates contained in the presentation, including any revisions to reflect changes in economic or market conditions or other circumstances arising after the date the items were made available to you or to reflect the occurrence of unanticipated events.
For avoidance of doubt, ICONIQ is not acting as an adviser or fiduciary in any respect in connection with providing this presentation and no relationship shall arise between you and ICONIQ as a result of this presentation being made available to you.
ICONIQ is a diversified financial services firm and has direct client relationships with persons that may become limited partners of ICONIQ funds. Notwithstanding that a person may be referred to herein as a "client" of the firm, no limited partner of any fund will, in its capacity as such, be a client of ICONIQ. There can be no assurance that the investments made by any ICONIQ fund will be profitable or will equal the performance of prior investments made by persons described in this presentation.
Any information in this presentation is directed at, and intended for, only persons who are experienced institutional or professional investors (“professional investors”) as defined by applicable law and regulation. Any person that is not a professional investor is not an intended recipient of this presentation and the matters discussed herein.
ICONIQ is a trading name of certain ICONIQ Partners (UK) LLP. ICONIQ Partners (UK) LLP (Registration Number: 973080) is an appointed representative of Kroll Securities Ltd. (Registration Number: 466588) which is authorised and regulated by the Financial Conduct Authority. ICONIQ Partners (UK) LLP is a limited liability partnership whose members are ICONIQ Capital (UK) Ltd, Seth Pierrepont and Lou Thorne, and it is registered in England and Wales and has its registered office at 27 Soho Square, London W1D 3QR. ICONIQ Partners (UK) LLP acts as an adviser to ICONIQ Capital LLC
Unless otherwise indicated, the views expressed in this presentation are those of ICONIQ Venture and Growth (“ICONIQ" or the “Firm"), are the result of proprietary research, may be subjective, and may not be relied upon in making an investment decision. Information used in this presentation was obtained from numerous sources. Certain of these companies are portfolio companies of ICONIQ Venture and Growth. ICONIQ Venture and Growth does not make any representations or warranties as to the accuracy of the information obtained from these sources.
This presentation is for general information purposes only and does not constitute investment advice. This presentation must not be relied upon in connection with any investment decision. The information in this presentation is not intended to and does not constitute financial, accounting, tax, legal, investment, consulting or other professional advice or services. Nothing in this presentation is or should be construed as an offer, invitation or solicitation to engage in any investment activity or transaction, including an offer to sell or a solicitation of an offer to buy any securities which should only be made pursuant to definitive offering documents and subscription agreements, including without limitation, any investment fund or investment product referenced herein.
Any reproduction or distribution of this presentation in whole or in part, or the disclosure of any of its contents, without the prior consent of ICONIQ, is strictly unauthorized.
This presentation may contain forward-looking statements based on current plans, estimates and projections. The recipient of this presentation ("you") are cautioned that a number of important factors could cause actual results or outcomes to differ materially from those expressed in, or implied by, the forward-looking statements. The numbers, figures and case studies included in this presentation have been included for purposes of illustration only, and no assurance can be given that the actual results of ICONIQ or any of its partners and affiliates will correspond with the results contemplated in the presentation. No information is contained herein with respect to conflicts of interest, which may be significant. The portfolio companies and other parties mentioned herein may reflect a selective list of the prior investments made by ICONIQ.
Certain of the economic and market information contained herein may have been obtained from published sources and/or prepared by other parties. While such sources are believed to be reliable, none of ICONIQ or any of its affiliates and partners, employees and representatives assume any responsibility for the accuracy of such information.
All of the information in the presentation is presented as of the date made available to you (except as otherwise specified), and is subject to change without notice, and may not be current or may have changed (possibly materially) between the date made available to you and the date actually received or reviewed by you. ICONIQ assumes no obligation to update or otherwise revise any information, projections, forecasts or estimates contained in the presentation, including any revisions to reflect changes in economic or market conditions or other circumstances arising after the date the items were made available to you or to reflect the occurrence of unanticipated events. Numbers or amounts herein may increase or decrease as a result of currency fluctuations.
For avoidance of doubt, ICONIQ is not acting as an adviser or fiduciary in any respect in connection with providing this presentation and no relationship shall arise between you and ICONIQ as a result of this presentation being made available to you.
ICONIQ is a diversified financial services firm and has direct client relationships with persons that may become limited partners of ICONIQ funds. Notwithstanding that a person may be referred to herein as a "client" of the firm, no limited partner of any fund will, in its capacity as such, be a client of ICONIQ. There can be no assurance that the investments made by any ICONIQ fund will be profitable or will equal the performance of prior investments made by persons described in this presentation.
Any information in this presentation is directed at, and intended for, only persons who are experienced institutional or professional investors (“professional investors”) as defined by applicable law and regulation. Any person that is not a professional investor is not an intended recipient of this presentation and the matters discussed herein.
ICONIQ is a trading name of ICONIQ Partners (UK) LLP. ICONIQ Partners (UK) LLP (Registration Number: 973080) is an appointed representative of Kroll Securities Ltd. (Registration Number: 466588) which is authorised and regulated by the Financial Conduct Authority. ICONIQ Partners (UK) LLP is a limited liability partnership whose members are ICONIQ Capital (UK) Ltd, Seth Pierrepont and Lou Thorne, and it is registered in England and Wales and has its registered office at 27 Soho Square, London W1D 3QR. ICONIQ Partners (UK) LLP acts as an adviser to ICONIQ Capital LLC