

Building The ModernGTM Org
What 150+ B2B GTM software leaders reveal about how AI, pricing shifts, and efficiency opportunities are reshaping the modern revenue organization.
At one AI-native company in our dataset, a single AI Customer Success Manager now covers the workload of roughly 20 human CSMs. At another, a voice-powered AI SDR handles more than ~90% of EMEA inbound volume before a human ever picks up. These aren't pilots, they're production systems already reshaping how revenue organizations are built.
The easy read on this is that AI is making GTM teams more productive, so companies are hiring less. That's true, but the more important shift is structural: the most AI-forward, high-performing companies are running GTM teams 20-30% leaner than their peers — and the org charts behind those numbers are starting to evolve.
Drawing on data from 150+ B2B software GTM leaders, we explore what's actually shifting, where orgs are holding flat, and what separates the teams that are pulling ahead from those still figuring it out. The findings reflect a market that has moved past the growth-at-all-costs era and is now optimizing for durability.
GTM Headcount in 2026: Modest Growth, Higher ARR per FTE
As AI adoption accelerates and efficiency becomes a board-level priority, GTM hiring has entered a more measured phase. Most companies planned modest headcount growth for 2026, a reflection of a growing opportunity to do more with existing teams as AI becomes more embedded across the GTM org.
That said, not all functions are being treated equally. Incremental hiring is concentrated in Sales and Post-Sales, where teams are expected to grow roughly 10-20% depending on company scale. Marketing and RevOps teams are expanding more slowly, which is partly driven by higher AI adoption than other GTM teams. In some cases, they're even staying flat, a sign that leaders are betting on AI tooling, process, and agency support before headcount.
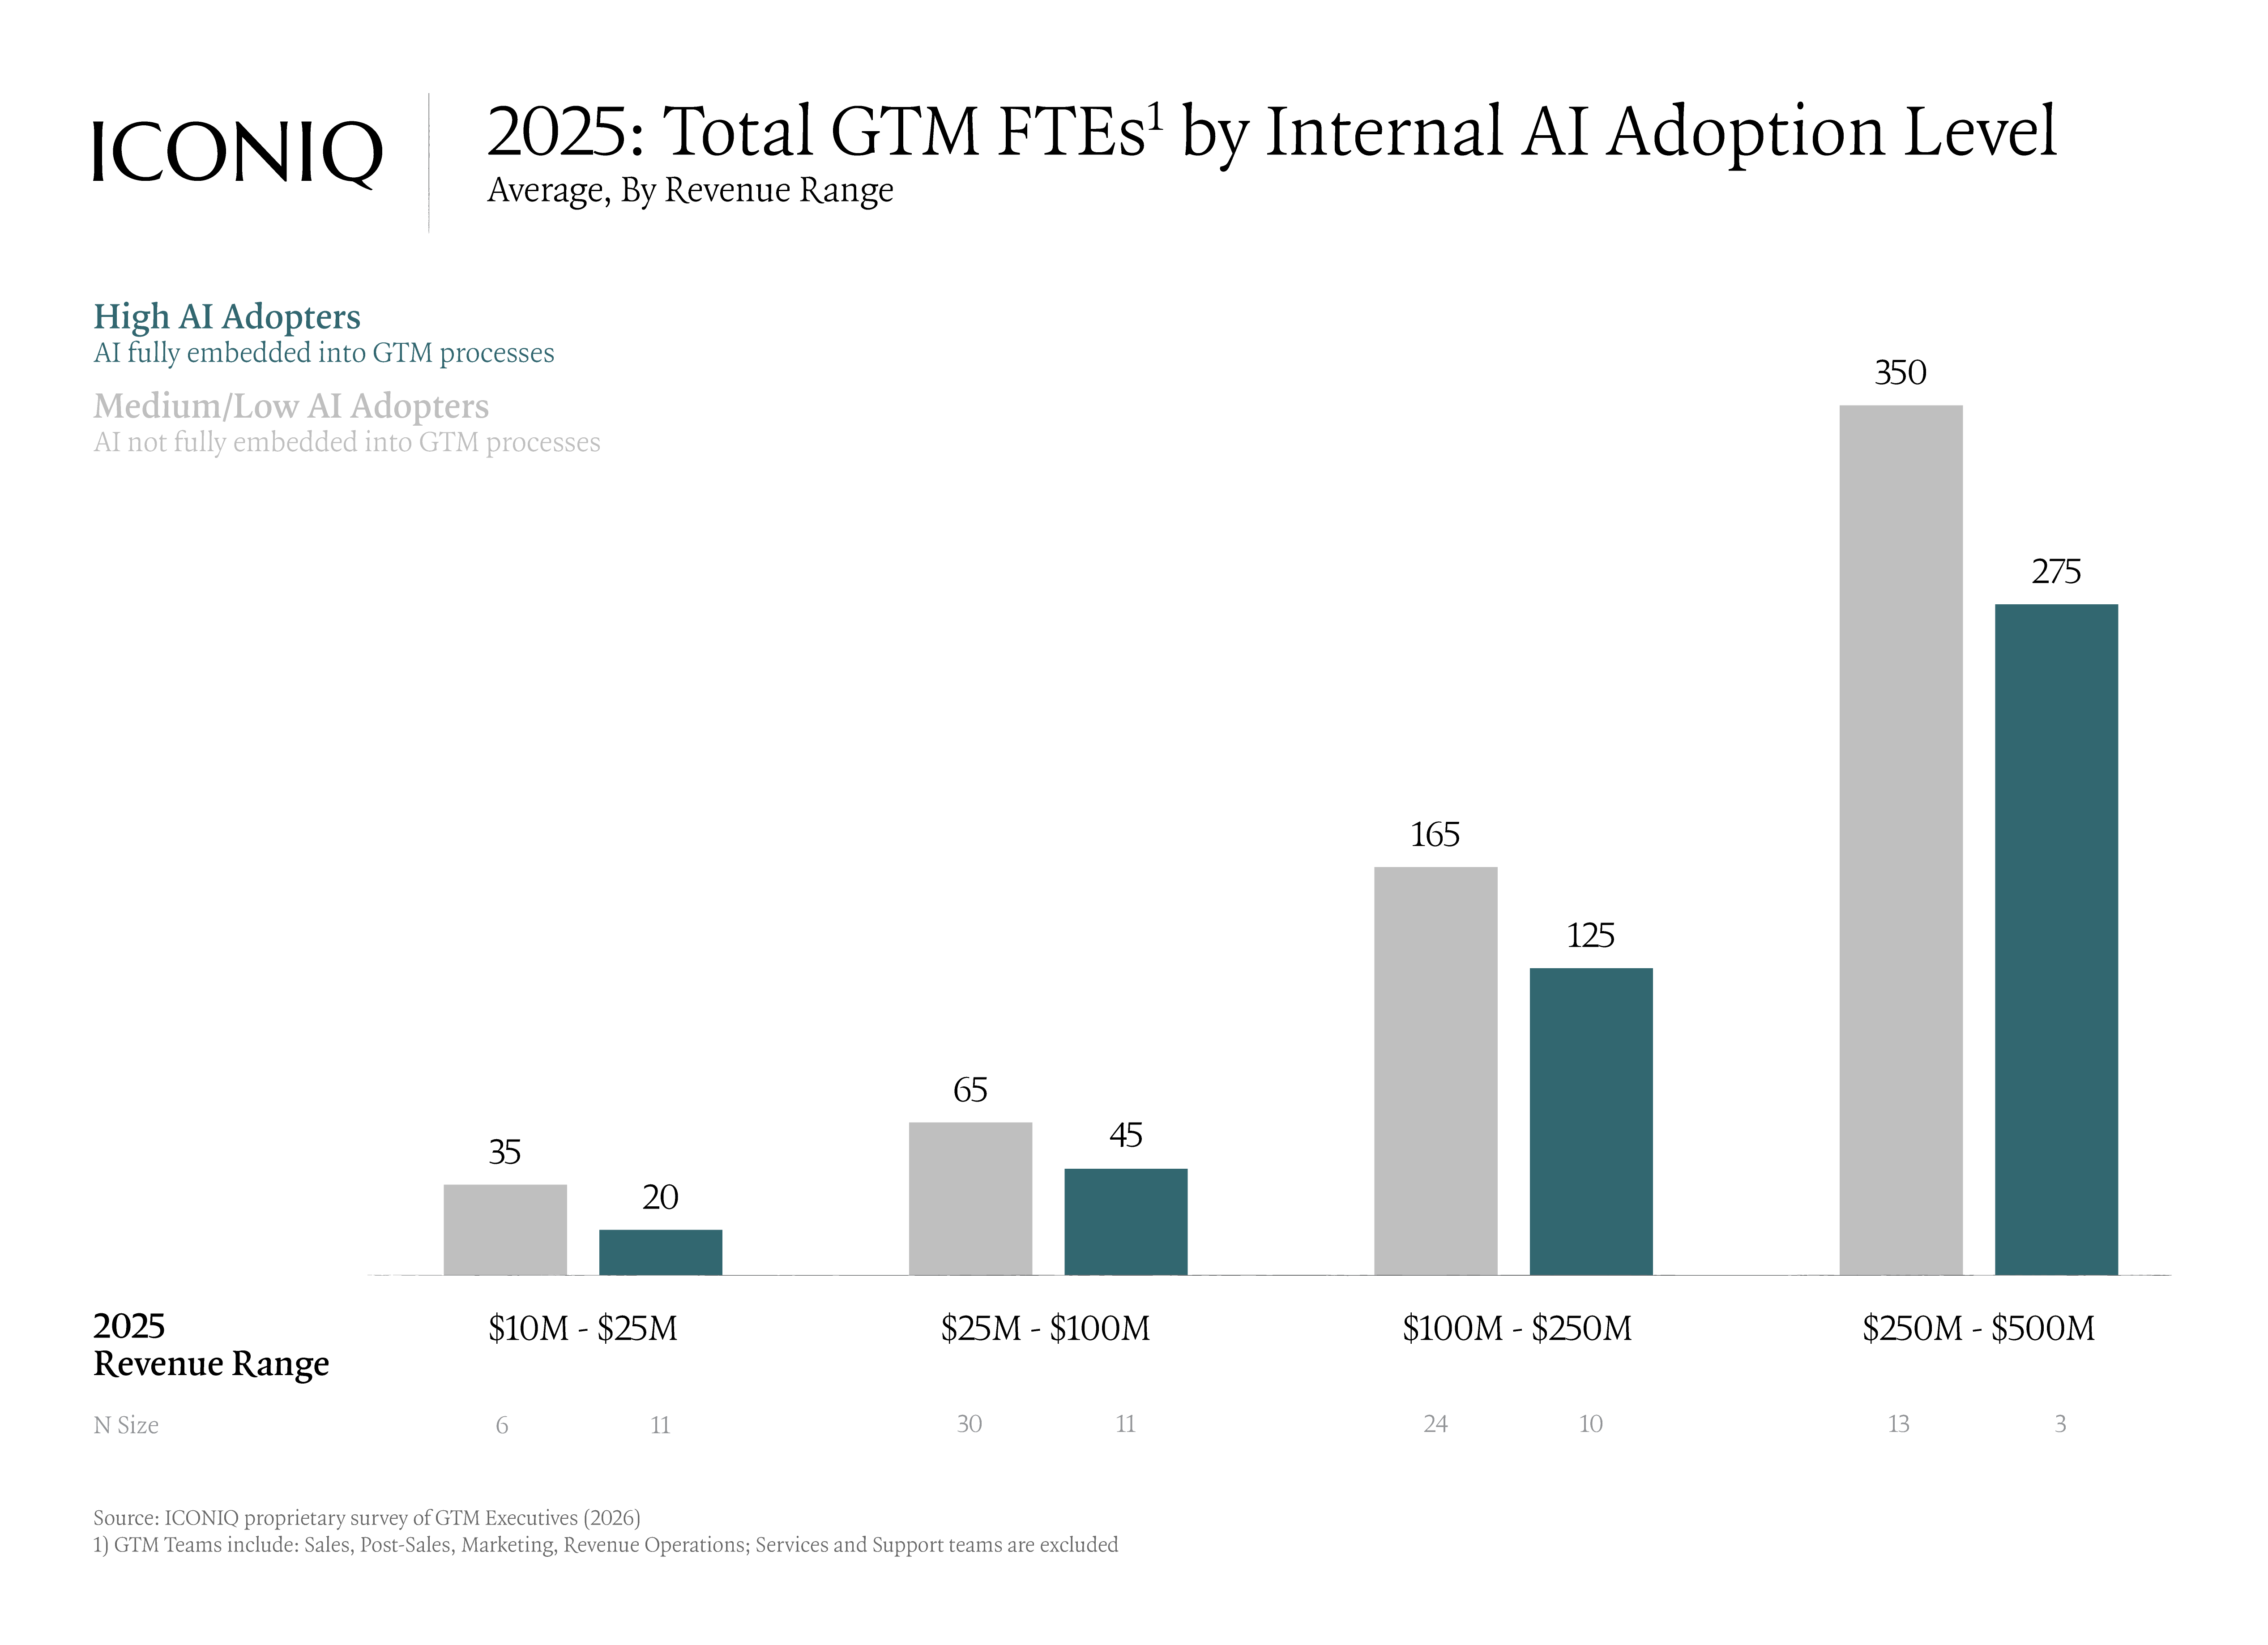
Leaner teams plus increased AI adoption is pushing Net New ARR per GTM FTE up across nearly every revenue band. Companies aren't just doing the same with less. They're expecting meaningfully more per head, and that expectation is baked into how teams are being run this year.
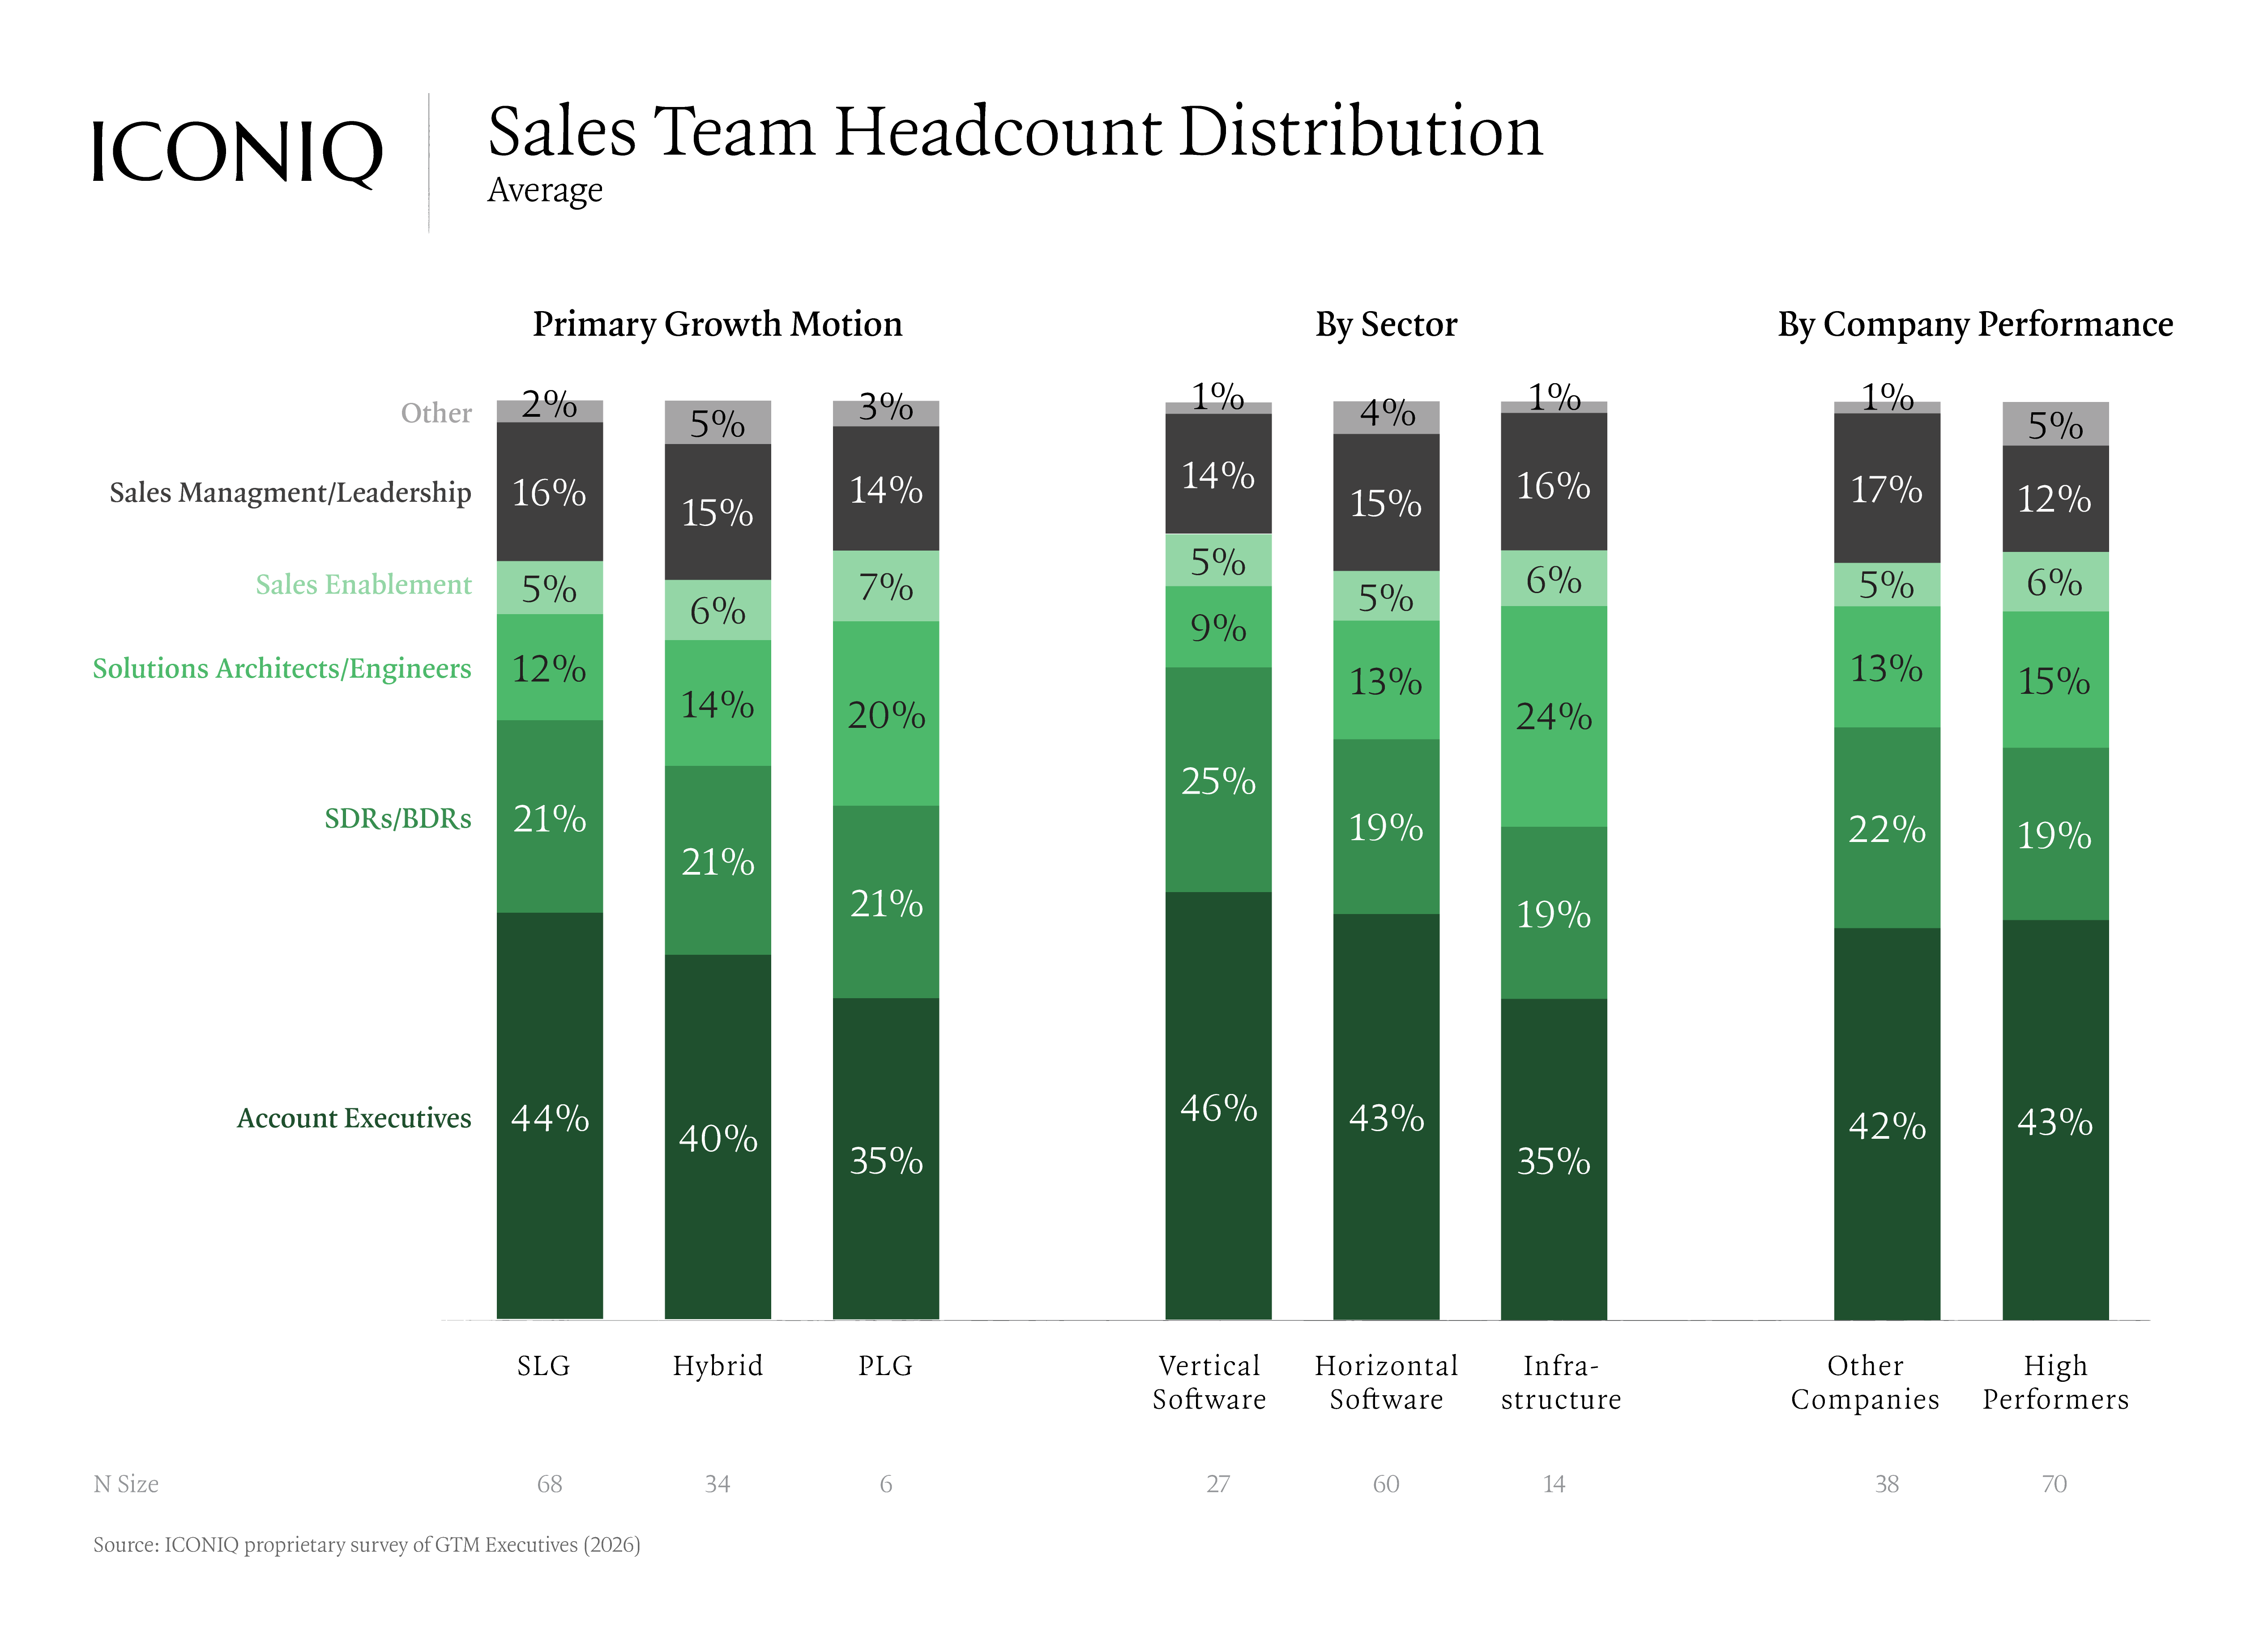
Within Sales, team structure has stayed consistent year-over-year, but composition varies sharply by business model. Sales-led growth companies allocate around 45% of headcount to Account Executives. Infrastructure companies lean harder on Solutions Architects and Solutions Engineers.
Key takeaways:
- Headcount growth is modest across the board. Sales and Post-Sales are growing; Marketing and RevOps are largely flat
- Many companies expect Net New ARR per GTM FTE to improve in 2026
- Team structure is consistent year-over-year but varies meaningfully by business model and product type


.png)
How AI Is Reshaping GTM: 2x Revenue per FTE and 10pt Sales Funnel Conversion Lifts
AI adoption is expanding across GTM functions, with Marketing, SDRs/BDRs, and AEs showing the strongest adoption — more than 65% of Marketing teams and 71% of SDR teams now have a majority of FTEs using AI regularly.
Early data suggests that this adoption is already translating into measurable performance improvements at the top of the sales funnel. Organizations with high AI adoption are seeing approximately 10 percentage point increases in both New Lead-to-MQL (38% vs. 27%) and MQL-to-SQL (37% vs. 29%) conversion rates.
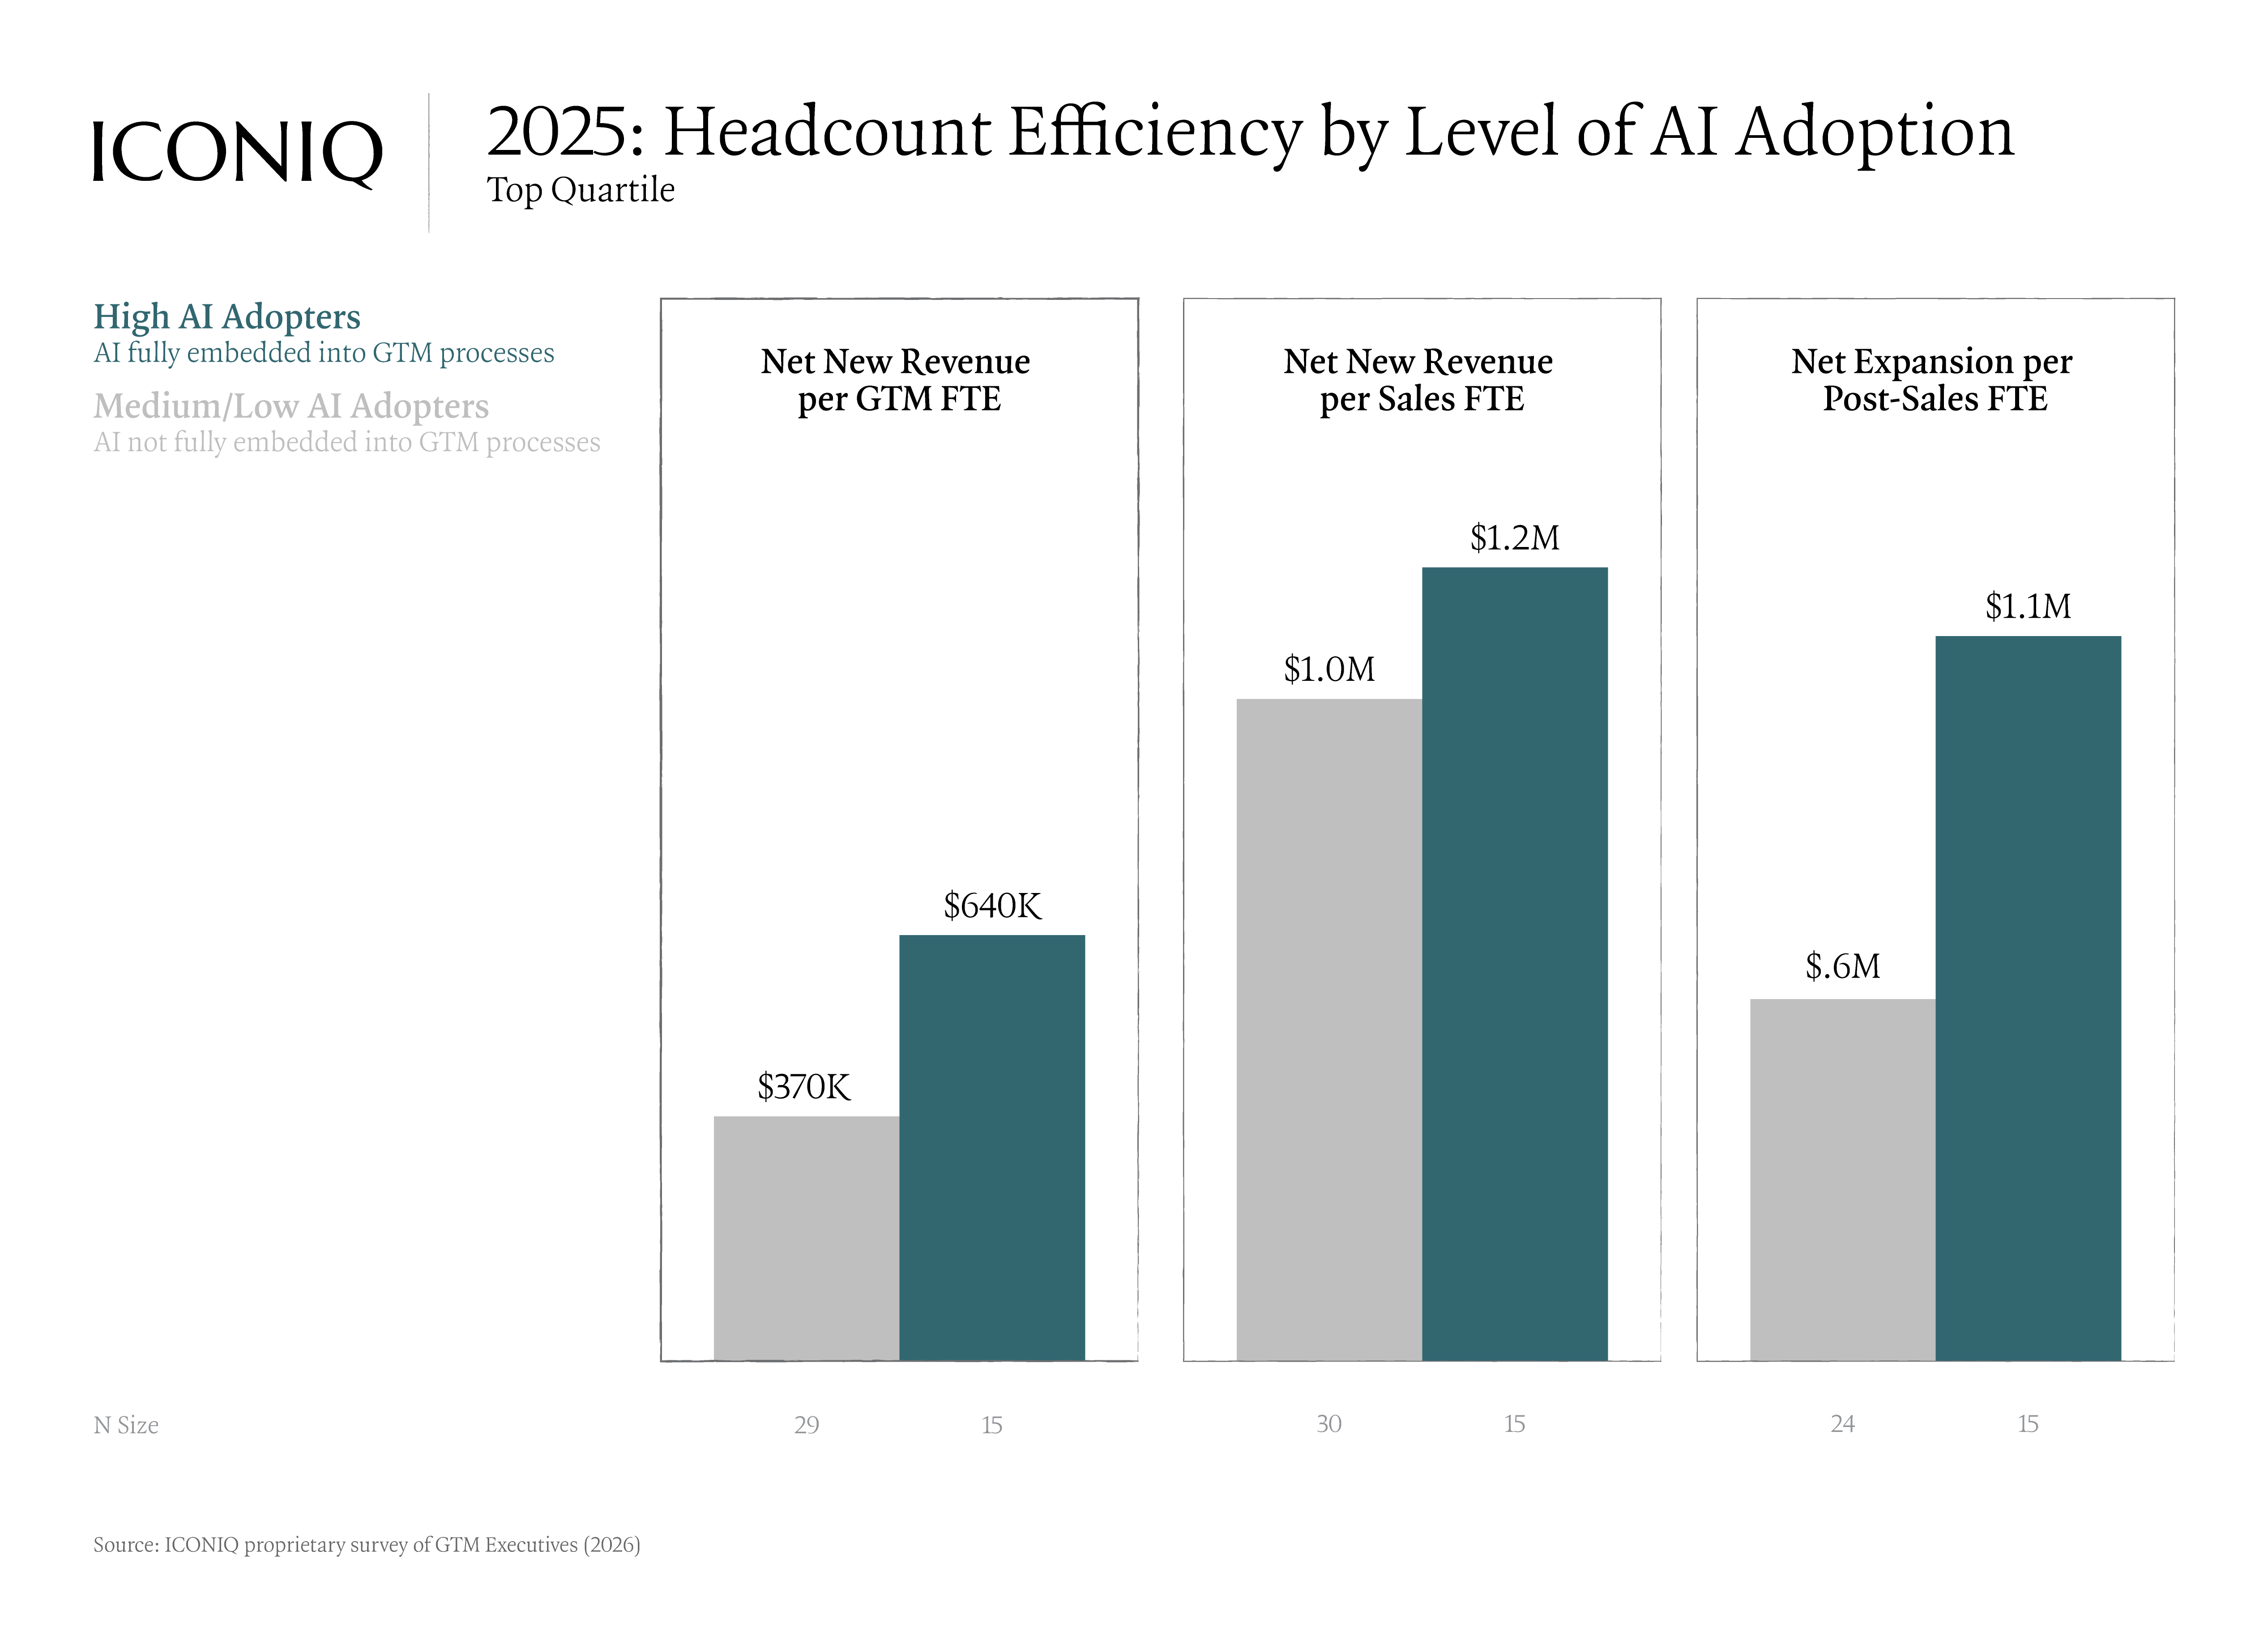
Beyond conversion improvements, AI is beginning to unlock meaningful efficiency gains, and the gap between high and low AI adopters is no longer subtle. High adopters generate roughly 2x Net New ARR per GTM FTE ($640K vs. $370K), and nearly 2x net expansion revenue per Post-Sales FTE ($1.1M vs. $600K). In this sense, AI is not just a productivity tool; it is becoming a core lever for scaling revenue without scaling headcount.
The shape of those leaner teams is also changing. At some AI-forward companies, the hiring mix is shifting from operators to builders. Rather than hiring 10 CSMs to cover 2,000 new accounts, one company hired 2 engineers to build an AI CSM. Frontline reps are increasingly building their own tools like prospecting agents, enrichment workflows, and post-call summarizers, RevOps then formalizes and scales these prototypes across the organization. In a few cases, top AEs have transitioned into full-time internal tooling roles, applying their domain knowledge to ship tools for the broader GTM team.
The open question for leadership now is, if a BDR becomes 5x more productive, do you hire fewer of them, or expand the role and hire more? The answer will shape GTM org design for the next several years.
Key Takeaways:
- High AI adopters generate ~2x Net New ARR per GTM FTE ($640K vs. $370K) and nearly 2x expansion revenue per Post-Sales FTE ($1.1M vs. $600K)
- Top-of-funnel conversion is also widening: high adopters see ~10 percentage point lifts in both New Lead-to-MQL and MQL-to-SQL rates
- AI Adoption is highest among Marketing, SDR/BDR, and AE teams while AMs and CSMs are catching up


How Pricing Models Are Redrawing the GTM Org Chart
At the same time, shifts in pricing models and go-to-market strategy are forcing companies to rethink how GTM teams are structured. As more businesses adopt hybrid and consumption-based pricing, there is increasing opportunity to land deals quickly and expand them over time.
This is driving a move toward more integrated ownership models. Rather than splitting responsibilities between “hunters” and “farmers,” many high-performing companies are consolidating ownership under Account Executives. In these organizations, AEs are responsible not just for closing new logos, but also for expansion through upsell and cross-sell. When executed well, this hybrid model appears to be a meaningful driver of outperformance.
Compensation structures are evolving accordingly. As revenue becomes more tied to usage and outcomes, companies are increasingly incentivizing AEs on metrics like Net New Recurring Revenue and Net Dollar Retention, rather than just initial contract value.
These shifts are also showing up in reporting lines. Customer Success Managers, who have traditionally sat under CS leadership, are increasingly reporting into Sales in consumption-driven businesses, reflecting their growing role in revenue expansion and retention. This reorganization happens when revenue depends on whether customers actually use the product, retention and expansion stop being a post-sale concern and become part of the revenue motion itself. CS leadership optimizes for customer health; Sales leadership optimizes for revenue — and in a consumption model, those are increasingly the same thing.
RevOps is undergoing a similar realignment. While it typically sits under Sales, it is also relatively common (though not the majority structure) for RevOps to report into Finance at companies with consumption- or outcome-based pricing models. Under consumption pricing, forecasting gets harder because revenue is no longer locked in at contract signature, and Data & Reporting balloons to ~30% of RevOp's time. Pulling RevOps closer to Finance gives the CFO direct line of sight into the assumptions driving the forecast, and tightens the loop between usage signals and financial planning.
Key Takeaways:
- High performing companies are giving AEs ownership of both new logo and expansion
- AE comp is shifting toward NRR and NDR, aligning incentives with long-term value over upfront deal size
- Reporting lines are being impacted by pricing models – CSMs trending toward Sales, RevOps trending toward Finance at consumption-based companies


As AI reshapes the go-to-market landscape, we believe companies that embrace AI-driven strategies and operations will be best positioned for accelerated growth and efficiency gains. Staying agile and proactively addressing AI integration challenges can differentiate market leaders from followers, making 2025 a pivotal year for GTM innovation and transformation.
Disclaimer
The views expressed in this presentation are those of ICONIQ Venture & Growth ("ICONIQ" or the "firm"), are the result of proprietary research, may be subjective, and may not be relied upon in making an investment decision.
This presentation is for general information purposes only and does not constitute investment advice. This presentation must not be relied upon in connection with any investment decision. The information in this presentation is not intended to and does not constitute financial, accounting, tax, legal, investment, consulting or other professional advice or services. Nothing in this presentation is or should be construed as an offer, invitation or solicitation to engage in any investment activity or transaction, including an offer to sell or a solicitation of an offer to buy any securities which should only be made pursuant to definitive offering documents and subscription agreements, including without limitation, any investment fund or investment product referenced herein.
Any reproduction or distribution of this presentation in whole or in part, or the disclosure of any of its contents, without the prior consent of ICONIQ, is strictly unauthorized.
This presentation may contain forward-looking statements based on current plans, estimates and projections. The recipient of this presentation ("you") are cautioned that a number of important factors could cause actual results or outcomes to differ materially from those expressed in, or implied by, the forward-looking statements. The numbers, figures and case studies included in this presentation have been included for purposes of illustration only, and no assurance can be given that the actual results of ICONIQ or any of its partners and affiliates will correspond with the results contemplated in the presentation. No information is contained herein with respect to conflicts of interest, which may be significant. The portfolio companies and other parties mentioned herein may reflect a selective list of the prior investments made by ICONIQ.
Certain of the economic and market information contained herein may have been obtained from published sources and/or prepared by other parties. While such sources are believed to be reliable, none of ICONIQ or any of its affiliates and partners, employees and representatives assume any responsibility for the accuracy of such information.
All of the information in the presentation is presented as of the date made available to you (except as otherwise specified), and is subject to change without notice, and may not be current or may have changed (possibly materially) between the date made available to you and the date actually received or reviewed by you. ICONIQ assumes no obligation to update or otherwise revise any information, projections, forecasts or estimates contained in the presentation, including any revisions to reflect changes in economic or market conditions or other circumstances arising after the date the items were made available to you or to reflect the occurrence of unanticipated events.
For avoidance of doubt, ICONIQ is not acting as an adviser or fiduciary in any respect in connection with providing this presentation and no relationship shall arise between you and ICONIQ as a result of this presentation being made available to you.
ICONIQ is a diversified financial services firm and has direct client relationships with persons that may become limited partners of ICONIQ funds. Notwithstanding that a person may be referred to herein as a "client" of the firm, no limited partner of any fund will, in its capacity as such, be a client of ICONIQ. There can be no assurance that the investments made by any ICONIQ fund will be profitable or will equal the performance of prior investments made by persons described in this presentation.
Any information in this presentation is directed at, and intended for, only persons who are experienced institutional or professional investors (“professional investors”) as defined by applicable law and regulation. Any person that is not a professional investor is not an intended recipient of this presentation and the matters discussed herein.
ICONIQ is a trading name of certain ICONIQ Partners (UK) LLP. ICONIQ Partners (UK) LLP (Registration Number: 973080) is an appointed representative of Kroll Securities Ltd. (Registration Number: 466588) which is authorised and regulated by the Financial Conduct Authority. ICONIQ Partners (UK) LLP is a limited liability partnership whose members are ICONIQ Capital (UK) Ltd, Seth Pierrepont and Lou Thorne, and it is registered in England and Wales and has its registered office at 27 Soho Square, London W1D 3QR. ICONIQ Partners (UK) LLP acts as an adviser to ICONIQ Capital LLC
Unless otherwise indicated, the views expressed in this presentation are those of ICONIQ Venture and Growth (“ICONIQ" or the “Firm"), are the result of proprietary research, may be subjective, and may not be relied upon in making an investment decision. Information used in this presentation was obtained from numerous sources. Certain of these companies are portfolio companies of ICONIQ Venture and Growth. ICONIQ Venture and Growth does not make any representations or warranties as to the accuracy of the information obtained from these sources.
This presentation is for general information purposes only and does not constitute investment advice. This presentation must not be relied upon in connection with any investment decision. The information in this presentation is not intended to and does not constitute financial, accounting, tax, legal, investment, consulting or other professional advice or services. Nothing in this presentation is or should be construed as an offer, invitation or solicitation to engage in any investment activity or transaction, including an offer to sell or a solicitation of an offer to buy any securities which should only be made pursuant to definitive offering documents and subscription agreements, including without limitation, any investment fund or investment product referenced herein.
Any reproduction or distribution of this presentation in whole or in part, or the disclosure of any of its contents, without the prior consent of ICONIQ, is strictly unauthorized.
This presentation may contain forward-looking statements based on current plans, estimates and projections. The recipient of this presentation ("you") are cautioned that a number of important factors could cause actual results or outcomes to differ materially from those expressed in, or implied by, the forward-looking statements. The numbers, figures and case studies included in this presentation have been included for purposes of illustration only, and no assurance can be given that the actual results of ICONIQ or any of its partners and affiliates will correspond with the results contemplated in the presentation. No information is contained herein with respect to conflicts of interest, which may be significant. The portfolio companies and other parties mentioned herein may reflect a selective list of the prior investments made by ICONIQ.
Certain of the economic and market information contained herein may have been obtained from published sources and/or prepared by other parties. While such sources are believed to be reliable, none of ICONIQ or any of its affiliates and partners, employees and representatives assume any responsibility for the accuracy of such information.
All of the information in the presentation is presented as of the date made available to you (except as otherwise specified), and is subject to change without notice, and may not be current or may have changed (possibly materially) between the date made available to you and the date actually received or reviewed by you. ICONIQ assumes no obligation to update or otherwise revise any information, projections, forecasts or estimates contained in the presentation, including any revisions to reflect changes in economic or market conditions or other circumstances arising after the date the items were made available to you or to reflect the occurrence of unanticipated events. Numbers or amounts herein may increase or decrease as a result of currency fluctuations.
For avoidance of doubt, ICONIQ is not acting as an adviser or fiduciary in any respect in connection with providing this presentation and no relationship shall arise between you and ICONIQ as a result of this presentation being made available to you.
ICONIQ is a diversified financial services firm and has direct client relationships with persons that may become limited partners of ICONIQ funds. Notwithstanding that a person may be referred to herein as a "client" of the firm, no limited partner of any fund will, in its capacity as such, be a client of ICONIQ. There can be no assurance that the investments made by any ICONIQ fund will be profitable or will equal the performance of prior investments made by persons described in this presentation.
Any information in this presentation is directed at, and intended for, only persons who are experienced institutional or professional investors (“professional investors”) as defined by applicable law and regulation. Any person that is not a professional investor is not an intended recipient of this presentation and the matters discussed herein.
ICONIQ is a trading name of ICONIQ Partners (UK) LLP. ICONIQ Partners (UK) LLP (Registration Number: 973080) is an appointed representative of Kroll Securities Ltd. (Registration Number: 466588) which is authorised and regulated by the Financial Conduct Authority. ICONIQ Partners (UK) LLP is a limited liability partnership whose members are ICONIQ Capital (UK) Ltd, Seth Pierrepont and Lou Thorne, and it is registered in England and Wales and has its registered office at 27 Soho Square, London W1D 3QR. ICONIQ Partners (UK) LLP acts as an adviser to ICONIQ Capital LLC